Zip Codes with the Highest Percentage of Population Employed in Sales & Related in Dearborn Heights, MI
RELATED REPORTS & OPTIONS
Sales & Related
Dearborn Heights
Compare Zip Codes
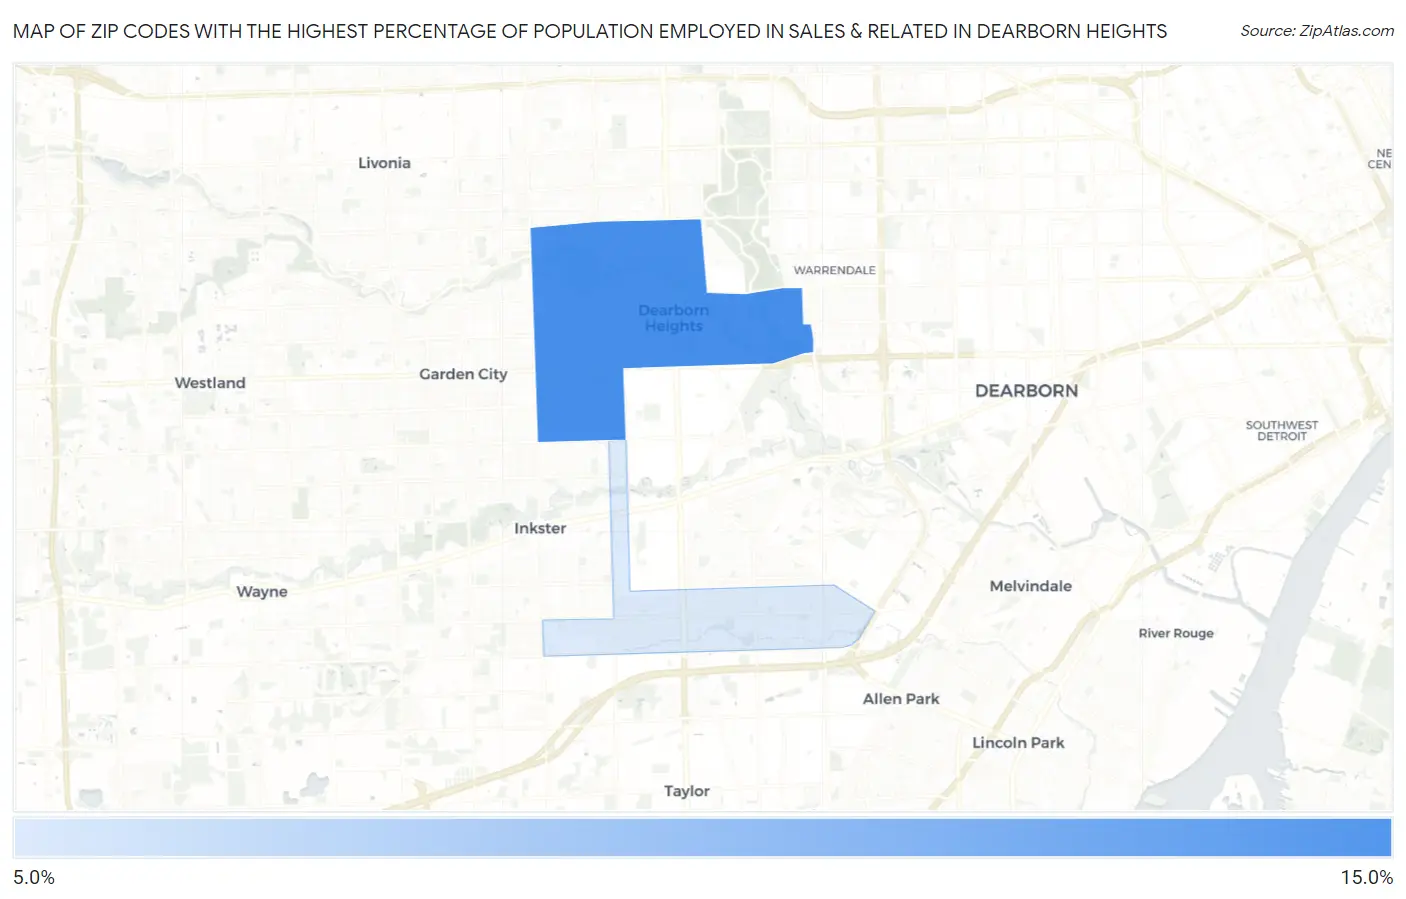
Map of Zip Codes with the Highest Percentage of Population Employed in Sales & Related in Dearborn Heights
9.9%
12.2%
Zip Codes with the Highest Percentage of Population Employed in Sales & Related in Dearborn Heights, MI
| Zip Code | % Employed | vs State | vs National | |
| 1. | 48127 | 12.2% | 9.1%(+3.02)#141 | 9.6%(+2.56)#5,756 |
| 2. | 48125 | 9.9% | 9.1%(+0.718)#304 | 9.6%(+0.261)#11,461 |
1
Common Questions
What are the Top Zip Codes with the Highest Percentage of Population Employed in Sales & Related in Dearborn Heights, MI?
Top Zip Codes with the Highest Percentage of Population Employed in Sales & Related in Dearborn Heights, MI are:
What zip code has the Highest Percentage of Population Employed in Sales & Related in Dearborn Heights, MI?
48127 has the Highest Percentage of Population Employed in Sales & Related in Dearborn Heights, MI with 12.2%.
What is the Percentage of Population Employed in Sales & Related in Dearborn Heights, MI?
Percentage of Population Employed in Sales & Related in Dearborn Heights is 11.3%.
What is the Percentage of Population Employed in Sales & Related in Michigan?
Percentage of Population Employed in Sales & Related in Michigan is 9.1%.
What is the Percentage of Population Employed in Sales & Related in the United States?
Percentage of Population Employed in Sales & Related in the United States is 9.6%.