Zip Codes with the Highest Percentage of Population Employed in Arts, Entertainment & Recreation in Clinton Township, MI
RELATED REPORTS & OPTIONS
Arts, Entertainment & Recreation
Clinton Township
Compare Zip Codes
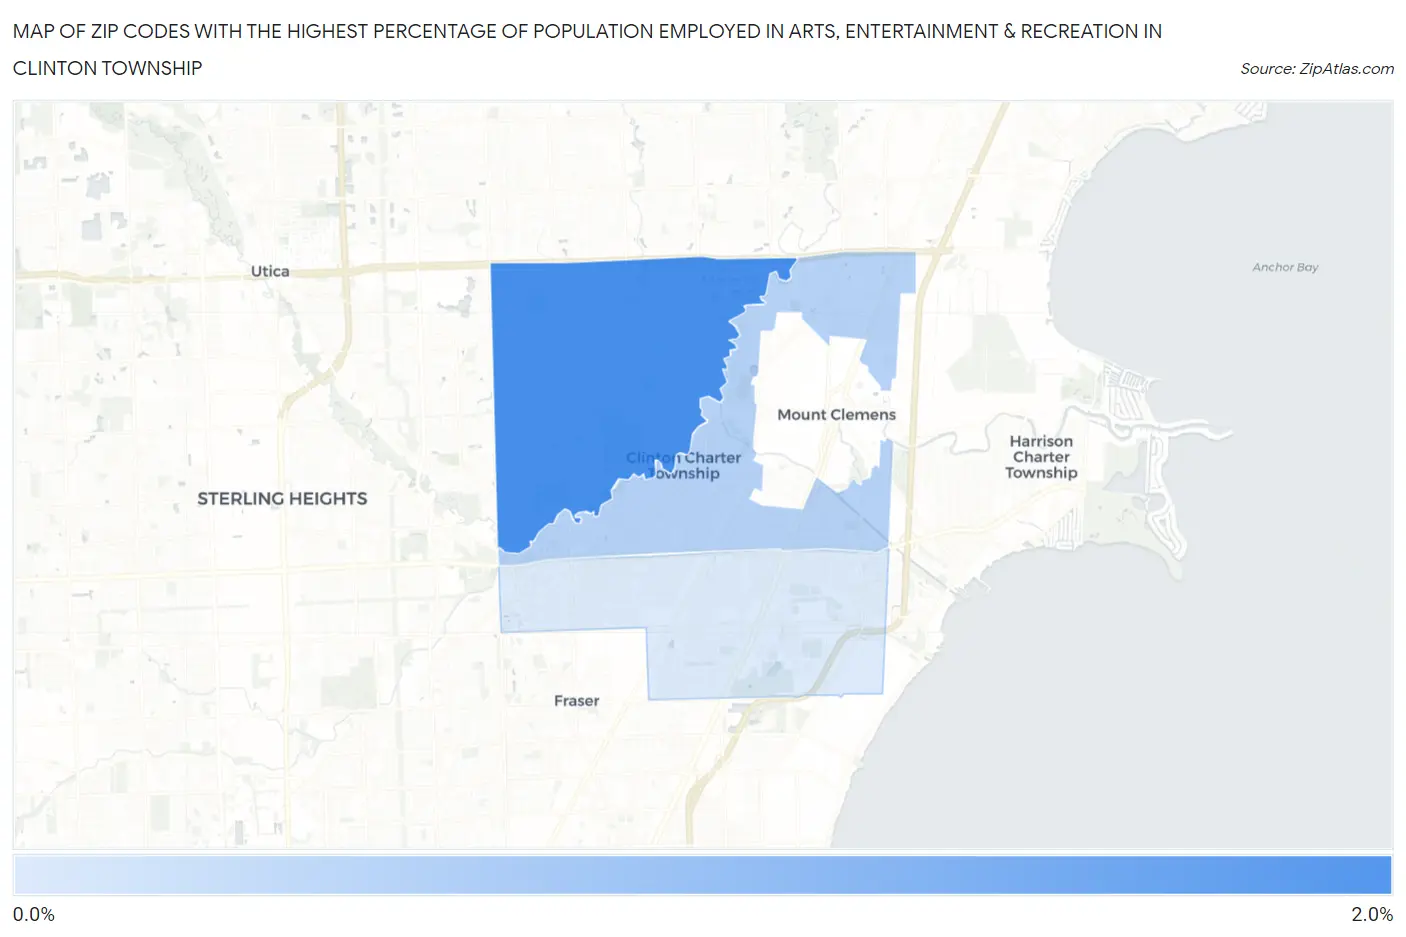
Map of Zip Codes with the Highest Percentage of Population Employed in Arts, Entertainment & Recreation in Clinton Township
0.0%
2.0%
Zip Codes with the Highest Percentage of Population Employed in Arts, Entertainment & Recreation in Clinton Township, MI
| Zip Code | % Employed | vs State | vs National | |
| 1. | 48038 | 1.9% | 1.8%(+0.073)#346 | 2.1%(-0.224)#10,636 |
| 2. | 48036 | 1.2% | 1.8%(-0.592)#566 | 2.1%(-0.889)#15,525 |
| 3. | 48035 | 0.96% | 1.8%(-0.824)#616 | 2.1%(-1.12)#17,241 |
1
Common Questions
What are the Top Zip Codes with the Highest Percentage of Population Employed in Arts, Entertainment & Recreation in Clinton Township, MI?
Top Zip Codes with the Highest Percentage of Population Employed in Arts, Entertainment & Recreation in Clinton Township, MI are:
What zip code has the Highest Percentage of Population Employed in Arts, Entertainment & Recreation in Clinton Township, MI?
48038 has the Highest Percentage of Population Employed in Arts, Entertainment & Recreation in Clinton Township, MI with 1.9%.
What is the Percentage of Population Employed in Arts, Entertainment & Recreation in Michigan?
Percentage of Population Employed in Arts, Entertainment & Recreation in Michigan is 1.8%.
What is the Percentage of Population Employed in Arts, Entertainment & Recreation in the United States?
Percentage of Population Employed in Arts, Entertainment & Recreation in the United States is 2.1%.