Cities with the Highest Percentage of Population Employed in Personal Care and Service in Michigan
RELATED REPORTS & OPTIONS
Personal Care and Service
Michigan
Compare Cities
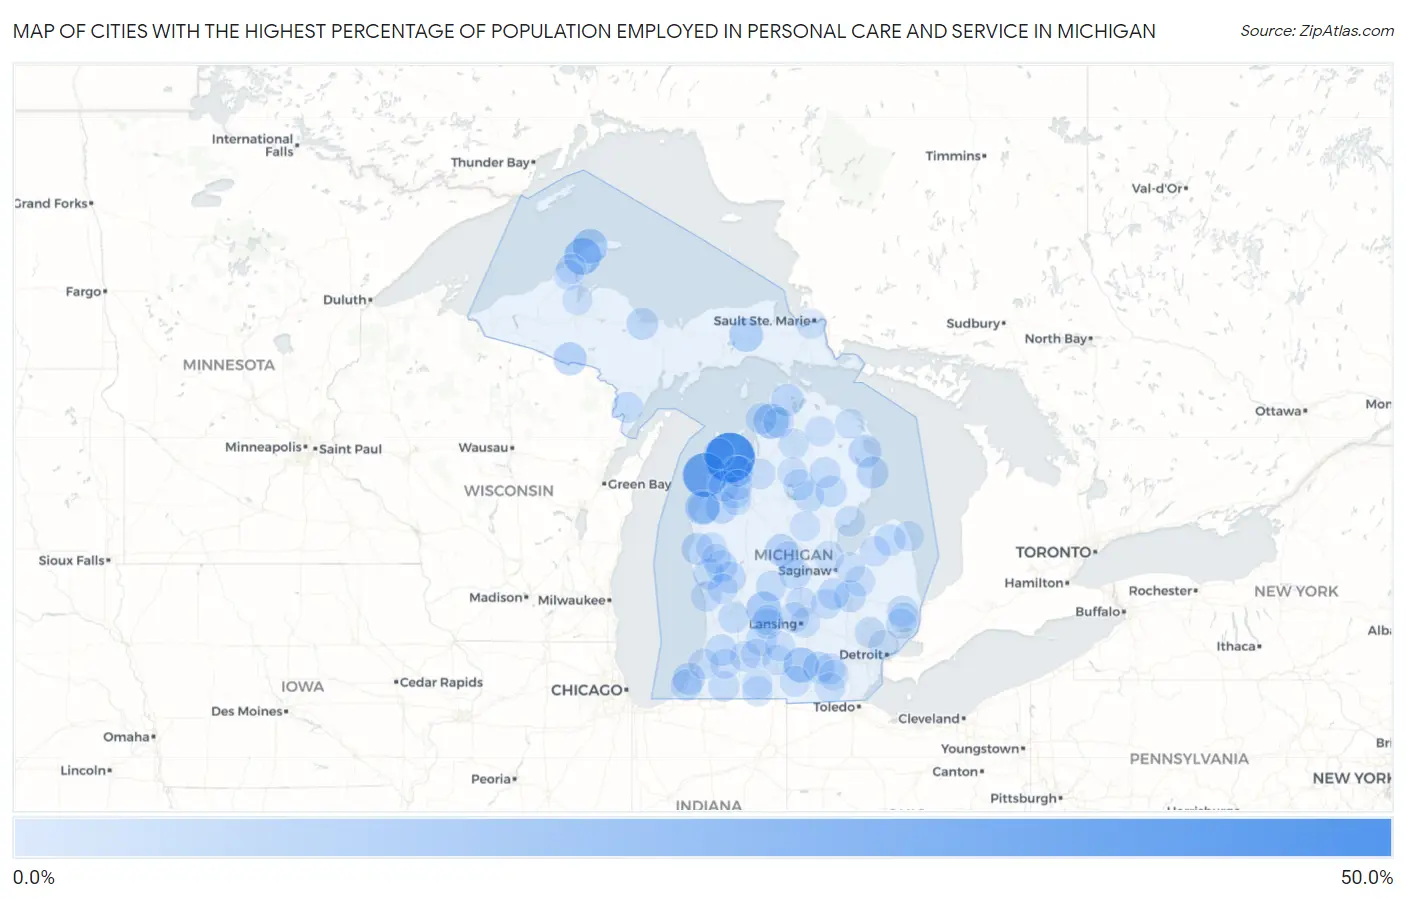
Map of Cities with the Highest Percentage of Population Employed in Personal Care and Service in Michigan
0.0%
50.0%
Cities with the Highest Percentage of Population Employed in Personal Care and Service in Michigan
| City | % Employed | vs State | vs National | |
| 1. | Cedar | 45.0% | 2.4%(+42.6)#1 | 2.6%(+42.4)#54 |
| 2. | Paris | 44.4% | 2.4%(+42.0)#2 | 2.6%(+41.9)#56 |
| 3. | Elberta | 33.3% | 2.4%(+30.9)#3 | 2.6%(+30.8)#93 |
| 4. | Ahmeek | 18.2% | 2.4%(+15.8)#4 | 2.6%(+15.6)#302 |
| 5. | Millburg | 17.5% | 2.4%(+15.1)#5 | 2.6%(+14.9)#321 |
| 6. | Horton Bay | 14.8% | 2.4%(+12.4)#6 | 2.6%(+12.3)#434 |
| 7. | Spring Arbor | 14.5% | 2.4%(+12.1)#7 | 2.6%(+12.0)#448 |
| 8. | Eagle River | 14.3% | 2.4%(+11.9)#8 | 2.6%(+11.7)#471 |
| 9. | Filer City | 13.8% | 2.4%(+11.4)#9 | 2.6%(+11.2)#503 |
| 10. | Saranac | 13.7% | 2.4%(+11.3)#10 | 2.6%(+11.2)#506 |
| 11. | Skanee | 12.8% | 2.4%(+10.4)#11 | 2.6%(+10.3)#573 |
| 12. | Rapid River | 12.7% | 2.4%(+10.3)#12 | 2.6%(+10.1)#584 |
| 13. | Newberry | 12.1% | 2.4%(+9.68)#13 | 2.6%(+9.52)#656 |
| 14. | Ruby | 11.7% | 2.4%(+9.33)#14 | 2.6%(+9.17)#691 |
| 15. | Gaastra | 10.6% | 2.4%(+8.18)#15 | 2.6%(+8.01)#837 |
| 16. | Ossineke | 9.6% | 2.4%(+7.19)#16 | 2.6%(+7.03)#1,011 |
| 17. | Pellston | 9.4% | 2.4%(+7.01)#17 | 2.6%(+6.84)#1,054 |
| 18. | Wellston | 9.3% | 2.4%(+6.93)#18 | 2.6%(+6.77)#1,071 |
| 19. | Cannonsburg | 8.7% | 2.4%(+6.34)#19 | 2.6%(+6.18)#1,222 |
| 20. | Stevensville | 8.6% | 2.4%(+6.21)#20 | 2.6%(+6.05)#1,254 |
| 21. | Harrisville | 8.5% | 2.4%(+6.09)#21 | 2.6%(+5.92)#1,292 |
| 22. | Hart | 8.5% | 2.4%(+6.08)#22 | 2.6%(+5.92)#1,293 |
| 23. | Beal City | 8.4% | 2.4%(+6.04)#23 | 2.6%(+5.87)#1,303 |
| 24. | Stronach | 8.3% | 2.4%(+5.93)#24 | 2.6%(+5.77)#1,329 |
| 25. | Napoleon | 8.2% | 2.4%(+5.81)#25 | 2.6%(+5.64)#1,370 |
| 26. | Beecher | 8.2% | 2.4%(+5.77)#26 | 2.6%(+5.61)#1,379 |
| 27. | Harvey | 8.0% | 2.4%(+5.61)#27 | 2.6%(+5.45)#1,431 |
| 28. | Fremont | 7.9% | 2.4%(+5.51)#28 | 2.6%(+5.34)#1,467 |
| 29. | Grant | 7.8% | 2.4%(+5.41)#29 | 2.6%(+5.25)#1,507 |
| 30. | New Lothrop | 7.5% | 2.4%(+5.14)#30 | 2.6%(+4.97)#1,621 |
| 31. | Mesick | 7.5% | 2.4%(+5.12)#31 | 2.6%(+4.96)#1,624 |
| 32. | Bridgman | 7.3% | 2.4%(+4.90)#32 | 2.6%(+4.74)#1,698 |
| 33. | Bad Axe | 7.3% | 2.4%(+4.89)#33 | 2.6%(+4.72)#1,702 |
| 34. | Bloomingdale | 7.1% | 2.4%(+4.74)#34 | 2.6%(+4.58)#1,757 |
| 35. | Lupton | 7.1% | 2.4%(+4.66)#35 | 2.6%(+4.50)#1,800 |
| 36. | Alma | 7.0% | 2.4%(+4.61)#36 | 2.6%(+4.45)#1,827 |
| 37. | Byron Center | 6.9% | 2.4%(+4.54)#37 | 2.6%(+4.38)#1,863 |
| 38. | Memphis | 6.9% | 2.4%(+4.47)#38 | 2.6%(+4.31)#1,903 |
| 39. | Charlevoix | 6.9% | 2.4%(+4.46)#39 | 2.6%(+4.29)#1,914 |
| 40. | St Helen | 6.7% | 2.4%(+4.31)#40 | 2.6%(+4.15)#1,987 |
| 41. | Dodgeville | 6.6% | 2.4%(+4.21)#41 | 2.6%(+4.05)#2,037 |
| 42. | Dowling | 6.6% | 2.4%(+4.17)#42 | 2.6%(+4.01)#2,059 |
| 43. | Daggett | 6.5% | 2.4%(+4.09)#43 | 2.6%(+3.93)#2,105 |
| 44. | Grawn | 6.5% | 2.4%(+4.08)#44 | 2.6%(+3.92)#2,111 |
| 45. | Roscommon | 6.4% | 2.4%(+4.04)#45 | 2.6%(+3.88)#2,138 |
| 46. | Twin Lake | 6.4% | 2.4%(+4.03)#46 | 2.6%(+3.87)#2,149 |
| 47. | Cambria | 6.4% | 2.4%(+4.02)#47 | 2.6%(+3.86)#2,154 |
| 48. | Woodland | 6.4% | 2.4%(+3.96)#48 | 2.6%(+3.80)#2,194 |
| 49. | Mio | 6.3% | 2.4%(+3.91)#49 | 2.6%(+3.75)#2,232 |
| 50. | Vandalia | 6.2% | 2.4%(+3.85)#50 | 2.6%(+3.69)#2,285 |
| 51. | Walloon Lake | 6.2% | 2.4%(+3.81)#51 | 2.6%(+3.65)#2,319 |
| 52. | South Boardman | 6.2% | 2.4%(+3.81)#52 | 2.6%(+3.65)#2,320 |
| 53. | Glen Arbor | 6.2% | 2.4%(+3.80)#53 | 2.6%(+3.63)#2,335 |
| 54. | Sheridan | 6.2% | 2.4%(+3.77)#54 | 2.6%(+3.61)#2,346 |
| 55. | Manchester | 6.1% | 2.4%(+3.73)#55 | 2.6%(+3.57)#2,370 |
| 56. | St Johns | 6.0% | 2.4%(+3.59)#56 | 2.6%(+3.43)#2,474 |
| 57. | Ferrysburg | 6.0% | 2.4%(+3.57)#57 | 2.6%(+3.40)#2,489 |
| 58. | Sylvan Lake | 5.9% | 2.4%(+3.53)#58 | 2.6%(+3.37)#2,515 |
| 59. | Copemish | 5.9% | 2.4%(+3.48)#59 | 2.6%(+3.32)#2,562 |
| 60. | Lake Odessa | 5.9% | 2.4%(+3.47)#60 | 2.6%(+3.30)#2,577 |
| 61. | Jonesville | 5.8% | 2.4%(+3.42)#61 | 2.6%(+3.26)#2,615 |
| 62. | Wacousta | 5.8% | 2.4%(+3.40)#62 | 2.6%(+3.24)#2,636 |
| 63. | Paw Paw Lake | 5.7% | 2.4%(+3.29)#63 | 2.6%(+3.13)#2,736 |
| 64. | New Haven | 5.7% | 2.4%(+3.28)#64 | 2.6%(+3.12)#2,741 |
| 65. | Eastwood | 5.6% | 2.4%(+3.25)#65 | 2.6%(+3.08)#2,781 |
| 66. | Chums Corner | 5.6% | 2.4%(+3.16)#66 | 2.6%(+2.99)#2,856 |
| 67. | Au Gres | 5.5% | 2.4%(+3.08)#67 | 2.6%(+2.92)#2,935 |
| 68. | Auburn | 5.4% | 2.4%(+3.04)#68 | 2.6%(+2.88)#2,967 |
| 69. | Harrietta | 5.4% | 2.4%(+2.98)#69 | 2.6%(+2.81)#3,036 |
| 70. | Augusta | 5.4% | 2.4%(+2.96)#70 | 2.6%(+2.79)#3,050 |
| 71. | Walkerville | 5.3% | 2.4%(+2.93)#71 | 2.6%(+2.77)#3,068 |
| 72. | Ravenna | 5.3% | 2.4%(+2.93)#72 | 2.6%(+2.77)#3,077 |
| 73. | Marshall | 5.3% | 2.4%(+2.93)#73 | 2.6%(+2.76)#3,083 |
| 74. | Harbor Beach | 5.3% | 2.4%(+2.92)#74 | 2.6%(+2.76)#3,085 |
| 75. | Mount Pleasant | 5.3% | 2.4%(+2.88)#75 | 2.6%(+2.71)#3,127 |
| 76. | South Range | 5.2% | 2.4%(+2.82)#76 | 2.6%(+2.65)#3,196 |
| 77. | Corunna | 5.1% | 2.4%(+2.74)#77 | 2.6%(+2.57)#3,278 |
| 78. | Burr Oak | 5.1% | 2.4%(+2.72)#78 | 2.6%(+2.56)#3,298 |
| 79. | Paw Paw | 5.1% | 2.4%(+2.72)#79 | 2.6%(+2.56)#3,307 |
| 80. | Clinton | 5.1% | 2.4%(+2.71)#80 | 2.6%(+2.55)#3,314 |
| 81. | Millington | 5.1% | 2.4%(+2.71)#81 | 2.6%(+2.55)#3,317 |
| 82. | Hazel Park | 5.1% | 2.4%(+2.68)#82 | 2.6%(+2.52)#3,346 |
| 83. | Buckley | 5.0% | 2.4%(+2.64)#83 | 2.6%(+2.48)#3,398 |
| 84. | Gagetown | 5.0% | 2.4%(+2.64)#84 | 2.6%(+2.48)#3,399 |
| 85. | Gaylord | 5.0% | 2.4%(+2.60)#85 | 2.6%(+2.43)#3,485 |
| 86. | Richmond | 4.9% | 2.4%(+2.53)#86 | 2.6%(+2.36)#3,562 |
| 87. | Reese | 4.9% | 2.4%(+2.52)#87 | 2.6%(+2.36)#3,565 |
| 88. | Olivet | 4.9% | 2.4%(+2.51)#88 | 2.6%(+2.35)#3,580 |
| 89. | Colon | 4.9% | 2.4%(+2.48)#89 | 2.6%(+2.32)#3,608 |
| 90. | Canada Creek Ranch | 4.9% | 2.4%(+2.48)#90 | 2.6%(+2.32)#3,616 |
| 91. | Baraga | 4.9% | 2.4%(+2.47)#91 | 2.6%(+2.31)#3,628 |
| 92. | Sault Ste Marie | 4.9% | 2.4%(+2.47)#92 | 2.6%(+2.31)#3,638 |
| 93. | Hancock | 4.9% | 2.4%(+2.46)#93 | 2.6%(+2.30)#3,645 |
| 94. | Gladwin | 4.8% | 2.4%(+2.43)#94 | 2.6%(+2.27)#3,688 |
| 95. | East Lansing | 4.7% | 2.4%(+2.34)#95 | 2.6%(+2.17)#3,803 |
| 96. | Adrian | 4.7% | 2.4%(+2.33)#96 | 2.6%(+2.17)#3,817 |
| 97. | Posen | 4.7% | 2.4%(+2.31)#97 | 2.6%(+2.14)#3,843 |
| 98. | Grayling | 4.7% | 2.4%(+2.30)#98 | 2.6%(+2.14)#3,851 |
| 99. | Ida | 4.7% | 2.4%(+2.28)#99 | 2.6%(+2.12)#3,875 |
| 100. | Hesperia | 4.6% | 2.4%(+2.25)#100 | 2.6%(+2.08)#3,934 |
Common Questions
What are the Top 10 Cities with the Highest Percentage of Population Employed in Personal Care and Service in Michigan?
Top 10 Cities with the Highest Percentage of Population Employed in Personal Care and Service in Michigan are:
#1
45.0%
#2
33.3%
#3
18.2%
#4
14.8%
#5
14.5%
#6
14.3%
#7
13.8%
#8
13.7%
#9
12.1%
#10
10.6%
What city has the Highest Percentage of Population Employed in Personal Care and Service in Michigan?
Cedar has the Highest Percentage of Population Employed in Personal Care and Service in Michigan with 45.0%.
What is the Percentage of Population Employed in Personal Care and Service in the State of Michigan?
Percentage of Population Employed in Personal Care and Service in Michigan is 2.4%.
What is the Percentage of Population Employed in Personal Care and Service in the United States?
Percentage of Population Employed in Personal Care and Service in the United States is 2.6%.