Cities with the Highest Percentage of Population Employed in Transportation in Michigan
RELATED REPORTS & OPTIONS
Transportation
Michigan
Compare Cities
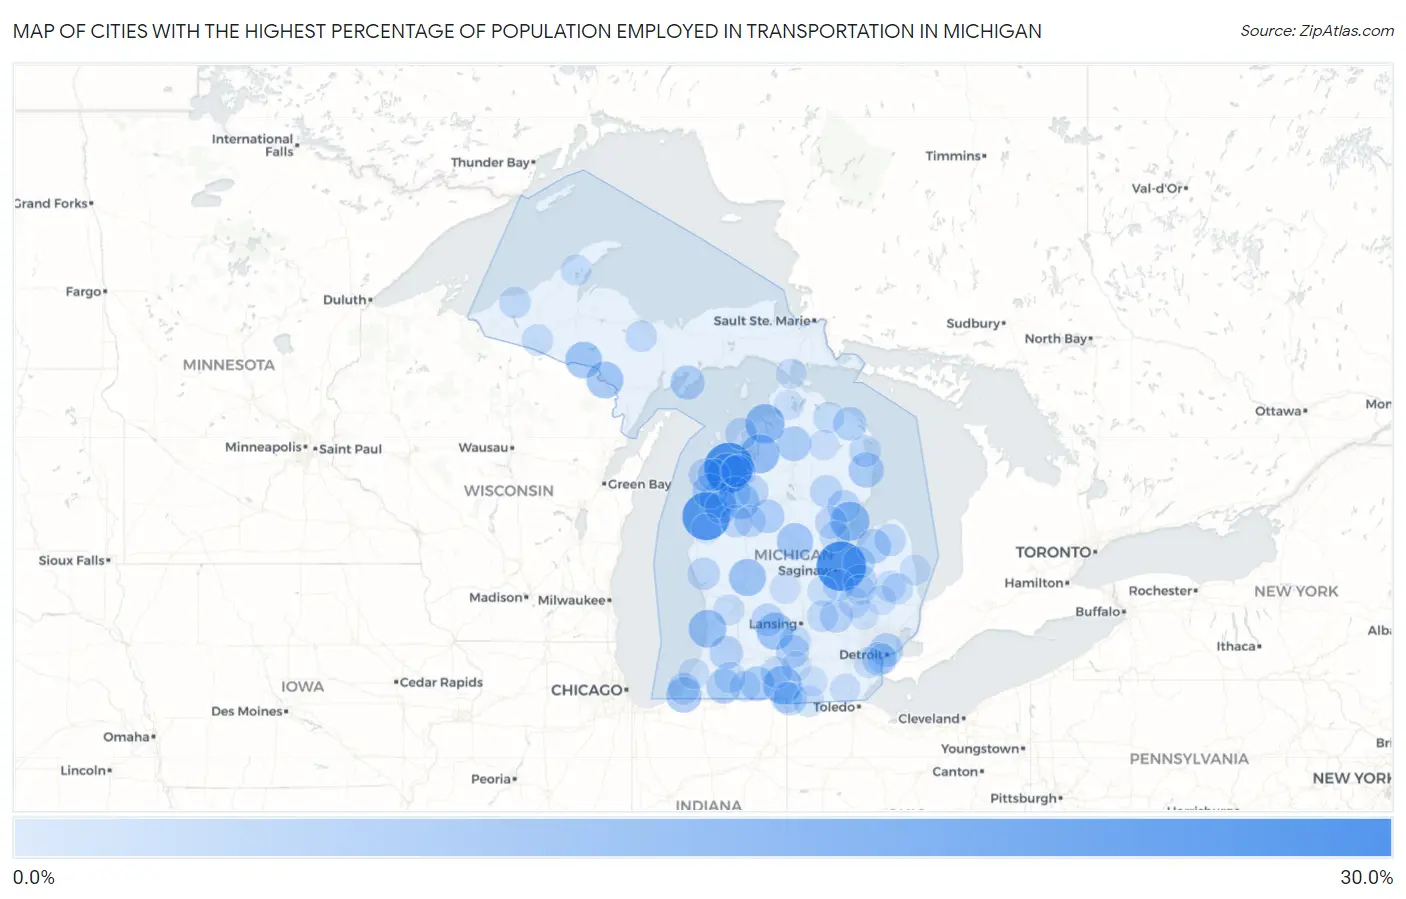
Map of Cities with the Highest Percentage of Population Employed in Transportation in Michigan
0.0%
30.0%
Cities with the Highest Percentage of Population Employed in Transportation in Michigan
| City | % Employed | vs State | vs National | |
| 1. | Robin Glen Indiantown | 28.3% | 3.6%(+24.7)#1 | 3.8%(+24.5)#379 |
| 2. | Hardwood Acres | 28.0% | 3.6%(+24.4)#2 | 3.8%(+24.2)#390 |
| 3. | Free Soil | 26.2% | 3.6%(+22.6)#3 | 3.8%(+22.4)#448 |
| 4. | Tower | 23.2% | 3.6%(+19.6)#4 | 3.8%(+19.4)#569 |
| 5. | Naubinway | 21.4% | 3.6%(+17.9)#5 | 3.8%(+17.6)#679 |
| 6. | Lake Gogebic | 19.0% | 3.6%(+15.5)#6 | 3.8%(+15.2)#875 |
| 7. | Bendon | 18.5% | 3.6%(+14.9)#7 | 3.8%(+14.7)#939 |
| 8. | Nunica | 18.4% | 3.6%(+14.9)#8 | 3.8%(+14.6)#941 |
| 9. | Winn | 16.9% | 3.6%(+13.4)#9 | 3.8%(+13.1)#1,129 |
| 10. | Ironton | 16.7% | 3.6%(+13.1)#10 | 3.8%(+12.8)#1,165 |
| 11. | Au Gres | 16.4% | 3.6%(+12.9)#11 | 3.8%(+12.6)#1,205 |
| 12. | Alden | 16.0% | 3.6%(+12.4)#12 | 3.8%(+12.2)#1,259 |
| 13. | Quincy | 15.9% | 3.6%(+12.3)#13 | 3.8%(+12.1)#1,279 |
| 14. | Saugatuck | 15.0% | 3.6%(+11.5)#14 | 3.8%(+11.2)#1,421 |
| 15. | Pierson | 14.3% | 3.6%(+10.7)#15 | 3.8%(+10.5)#1,571 |
| 16. | Vermontville | 14.2% | 3.6%(+10.6)#16 | 3.8%(+10.4)#1,595 |
| 17. | Quinnesec | 14.0% | 3.6%(+10.5)#17 | 3.8%(+10.2)#1,637 |
| 18. | Alpha | 13.8% | 3.6%(+10.3)#18 | 3.8%(+10.0)#1,676 |
| 19. | Brethren | 13.6% | 3.6%(+10.1)#19 | 3.8%(+9.82)#1,720 |
| 20. | Loomis | 13.4% | 3.6%(+9.86)#20 | 3.8%(+9.61)#1,776 |
| 21. | Hermansville | 13.4% | 3.6%(+9.80)#21 | 3.8%(+9.55)#1,795 |
| 22. | Boon | 13.0% | 3.6%(+9.48)#22 | 3.8%(+9.23)#1,883 |
| 23. | Dodgeville | 12.8% | 3.6%(+9.21)#23 | 3.8%(+8.96)#1,965 |
| 24. | Three Oaks | 12.6% | 3.6%(+9.01)#24 | 3.8%(+8.76)#2,023 |
| 25. | Bear Lake | 12.3% | 3.6%(+8.70)#25 | 3.8%(+8.45)#2,133 |
| 26. | Lincoln | 12.2% | 3.6%(+8.63)#26 | 3.8%(+8.38)#2,159 |
| 27. | Ramsay | 12.1% | 3.6%(+8.56)#27 | 3.8%(+8.30)#2,181 |
| 28. | Colon | 12.0% | 3.6%(+8.39)#28 | 3.8%(+8.14)#2,247 |
| 29. | Vandalia | 11.9% | 3.6%(+8.37)#29 | 3.8%(+8.11)#2,253 |
| 30. | Cambria | 11.9% | 3.6%(+8.36)#30 | 3.8%(+8.11)#2,256 |
| 31. | Gaylord | 11.8% | 3.6%(+8.28)#31 | 3.8%(+8.03)#2,288 |
| 32. | Bruce Crossing | 11.5% | 3.6%(+7.97)#32 | 3.8%(+7.72)#2,412 |
| 33. | Garden | 11.4% | 3.6%(+7.86)#33 | 3.8%(+7.61)#2,462 |
| 34. | Owendale | 11.3% | 3.6%(+7.74)#34 | 3.8%(+7.49)#2,513 |
| 35. | Ida | 11.3% | 3.6%(+7.73)#35 | 3.8%(+7.48)#2,516 |
| 36. | Chums Corner | 11.1% | 3.6%(+7.55)#36 | 3.8%(+7.29)#2,575 |
| 37. | Marion | 11.1% | 3.6%(+7.49)#37 | 3.8%(+7.24)#2,616 |
| 38. | Hamtramck | 10.7% | 3.6%(+7.14)#38 | 3.8%(+6.89)#2,751 |
| 39. | Melvindale | 10.6% | 3.6%(+7.05)#39 | 3.8%(+6.80)#2,788 |
| 40. | Posen | 10.6% | 3.6%(+7.02)#40 | 3.8%(+6.77)#2,808 |
| 41. | Gobles | 10.5% | 3.6%(+6.92)#41 | 3.8%(+6.67)#2,851 |
| 42. | Millington | 10.4% | 3.6%(+6.85)#42 | 3.8%(+6.60)#2,893 |
| 43. | Camden | 10.2% | 3.6%(+6.68)#43 | 3.8%(+6.43)#2,995 |
| 44. | Byron | 10.0% | 3.6%(+6.40)#44 | 3.8%(+6.15)#3,154 |
| 45. | Springport | 9.9% | 3.6%(+6.32)#45 | 3.8%(+6.07)#3,199 |
| 46. | Painesdale | 9.8% | 3.6%(+6.21)#46 | 3.8%(+5.96)#3,257 |
| 47. | Elberta | 9.7% | 3.6%(+6.16)#47 | 3.8%(+5.91)#3,305 |
| 48. | Whittemore | 9.6% | 3.6%(+6.03)#48 | 3.8%(+5.78)#3,380 |
| 49. | Lake Odessa | 9.6% | 3.6%(+6.01)#49 | 3.8%(+5.76)#3,396 |
| 50. | Fairgrove | 9.4% | 3.6%(+5.88)#50 | 3.8%(+5.63)#3,482 |
| 51. | Wellston | 9.3% | 3.6%(+5.77)#51 | 3.8%(+5.52)#3,559 |
| 52. | Lakewood Club | 9.3% | 3.6%(+5.74)#52 | 3.8%(+5.49)#3,570 |
| 53. | Rose City | 9.3% | 3.6%(+5.69)#53 | 3.8%(+5.44)#3,604 |
| 54. | Luther | 9.3% | 3.6%(+5.69)#54 | 3.8%(+5.44)#3,607 |
| 55. | Sterling | 9.2% | 3.6%(+5.65)#55 | 3.8%(+5.40)#3,639 |
| 56. | Greenland | 9.2% | 3.6%(+5.65)#56 | 3.8%(+5.39)#3,647 |
| 57. | Northport | 9.2% | 3.6%(+5.58)#57 | 3.8%(+5.33)#3,699 |
| 58. | Benzonia | 9.1% | 3.6%(+5.58)#58 | 3.8%(+5.33)#3,700 |
| 59. | Manton | 9.1% | 3.6%(+5.53)#59 | 3.8%(+5.27)#3,726 |
| 60. | Bad Axe | 9.0% | 3.6%(+5.46)#60 | 3.8%(+5.21)#3,807 |
| 61. | Mesick | 9.0% | 3.6%(+5.46)#61 | 3.8%(+5.21)#3,809 |
| 62. | Falmouth | 8.9% | 3.6%(+5.35)#62 | 3.8%(+5.09)#3,895 |
| 63. | Le Roy | 8.9% | 3.6%(+5.32)#63 | 3.8%(+5.07)#3,914 |
| 64. | Shorewood Tower Hills Harbert | 8.8% | 3.6%(+5.27)#64 | 3.8%(+5.02)#3,953 |
| 65. | Ossineke | 8.8% | 3.6%(+5.20)#65 | 3.8%(+4.95)#4,012 |
| 66. | Grawn | 8.6% | 3.6%(+5.08)#66 | 3.8%(+4.83)#4,130 |
| 67. | Tekonsha | 8.6% | 3.6%(+5.06)#67 | 3.8%(+4.80)#4,142 |
| 68. | White Pine | 8.5% | 3.6%(+4.91)#68 | 3.8%(+4.66)#4,287 |
| 69. | Burt | 8.5% | 3.6%(+4.90)#69 | 3.8%(+4.65)#4,296 |
| 70. | K I Sawyer | 8.4% | 3.6%(+4.86)#70 | 3.8%(+4.60)#4,337 |
| 71. | Watersmeet | 8.4% | 3.6%(+4.84)#71 | 3.8%(+4.59)#4,358 |
| 72. | Marcellus | 8.3% | 3.6%(+4.71)#72 | 3.8%(+4.46)#4,506 |
| 73. | Morrice | 8.2% | 3.6%(+4.65)#73 | 3.8%(+4.40)#4,558 |
| 74. | Montgomery | 8.2% | 3.6%(+4.64)#74 | 3.8%(+4.39)#4,564 |
| 75. | Eaton Rapids | 8.2% | 3.6%(+4.63)#75 | 3.8%(+4.38)#4,574 |
| 76. | Millersburg | 8.2% | 3.6%(+4.60)#76 | 3.8%(+4.35)#4,616 |
| 77. | Waldron | 8.1% | 3.6%(+4.53)#77 | 3.8%(+4.28)#4,675 |
| 78. | Burton | 8.0% | 3.6%(+4.46)#78 | 3.8%(+4.21)#4,735 |
| 79. | Brown City | 8.0% | 3.6%(+4.44)#79 | 3.8%(+4.19)#4,755 |
| 80. | Jenison | 8.0% | 3.6%(+4.39)#80 | 3.8%(+4.14)#4,799 |
| 81. | Dollar Bay | 7.9% | 3.6%(+4.35)#81 | 3.8%(+4.10)#4,839 |
| 82. | Melvin | 7.9% | 3.6%(+4.33)#82 | 3.8%(+4.08)#4,860 |
| 83. | Centreville | 7.9% | 3.6%(+4.32)#83 | 3.8%(+4.07)#4,868 |
| 84. | Pinconning | 7.9% | 3.6%(+4.29)#84 | 3.8%(+4.04)#4,894 |
| 85. | Fair Plain | 7.7% | 3.6%(+4.11)#85 | 3.8%(+3.86)#5,129 |
| 86. | Port Sanilac | 7.5% | 3.6%(+3.92)#86 | 3.8%(+3.67)#5,338 |
| 87. | Otisville | 7.4% | 3.6%(+3.85)#87 | 3.8%(+3.60)#5,410 |
| 88. | St Ignace | 7.4% | 3.6%(+3.80)#88 | 3.8%(+3.55)#5,490 |
| 89. | Romulus | 7.3% | 3.6%(+3.78)#89 | 3.8%(+3.53)#5,512 |
| 90. | Carson City | 7.2% | 3.6%(+3.68)#90 | 3.8%(+3.43)#5,643 |
| 91. | River Rouge | 7.2% | 3.6%(+3.67)#91 | 3.8%(+3.42)#5,665 |
| 92. | Atlanta | 7.2% | 3.6%(+3.62)#92 | 3.8%(+3.37)#5,721 |
| 93. | Deerfield | 7.2% | 3.6%(+3.59)#93 | 3.8%(+3.34)#5,744 |
| 94. | Brutus | 7.1% | 3.6%(+3.52)#94 | 3.8%(+3.27)#5,864 |
| 95. | Oakley | 7.1% | 3.6%(+3.51)#95 | 3.8%(+3.26)#5,878 |
| 96. | Addison | 6.9% | 3.6%(+3.32)#96 | 3.8%(+3.07)#6,146 |
| 97. | Attica | 6.9% | 3.6%(+3.30)#97 | 3.8%(+3.05)#6,167 |
| 98. | Ortonville | 6.8% | 3.6%(+3.27)#98 | 3.8%(+3.02)#6,216 |
| 99. | Concord | 6.8% | 3.6%(+3.27)#99 | 3.8%(+3.01)#6,220 |
| 100. | Custer | 6.8% | 3.6%(+3.24)#100 | 3.8%(+2.99)#6,264 |
Common Questions
What are the Top 10 Cities with the Highest Percentage of Population Employed in Transportation in Michigan?
Top 10 Cities with the Highest Percentage of Population Employed in Transportation in Michigan are:
#1
28.3%
#2
28.0%
#3
26.2%
#4
18.5%
#5
16.7%
#6
16.4%
#7
16.0%
#8
15.9%
#9
15.0%
#10
14.3%
What city has the Highest Percentage of Population Employed in Transportation in Michigan?
Robin Glen Indiantown has the Highest Percentage of Population Employed in Transportation in Michigan with 28.3%.
What is the Percentage of Population Employed in Transportation in the State of Michigan?
Percentage of Population Employed in Transportation in Michigan is 3.6%.
What is the Percentage of Population Employed in Transportation in the United States?
Percentage of Population Employed in Transportation in the United States is 3.8%.