Cities with the Highest Percentage of Population Employed in Finance & Insurance in Michigan
RELATED REPORTS & OPTIONS
Finance & Insurance
Michigan
Compare Cities
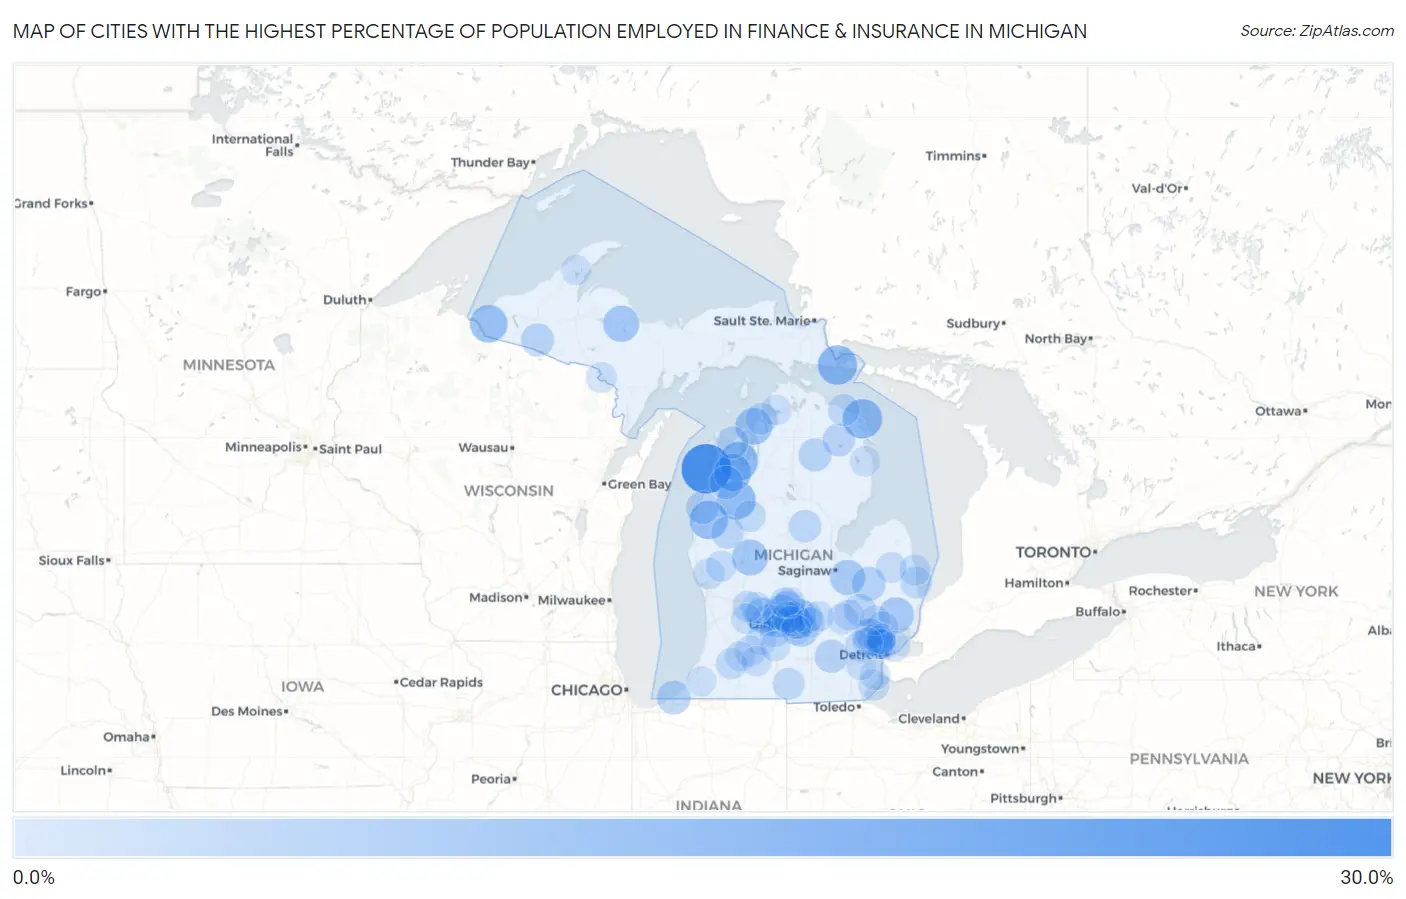
Map of Cities with the Highest Percentage of Population Employed in Finance & Insurance in Michigan
0.0%
30.0%
Cities with the Highest Percentage of Population Employed in Finance & Insurance in Michigan
| City | % Employed | vs State | vs National | |
| 1. | Crystal Downs Country Club | 30.0% | 4.2%(+25.8)#1 | 4.8%(+25.2)#156 |
| 2. | Cannonsburg | 24.3% | 4.2%(+20.0)#2 | 4.8%(+19.5)#233 |
| 3. | Eureka | 19.7% | 4.2%(+15.4)#3 | 4.8%(+14.9)#385 |
| 4. | Naubinway | 19.0% | 4.2%(+14.8)#4 | 4.8%(+14.3)#413 |
| 5. | De Tour Village | 17.8% | 4.2%(+13.6)#5 | 4.8%(+13.0)#479 |
| 6. | Presque Isle Harbor | 17.6% | 4.2%(+13.4)#6 | 4.8%(+12.9)#492 |
| 7. | Harrietta | 17.2% | 4.2%(+13.0)#7 | 4.8%(+12.4)#507 |
| 8. | Greilickville | 16.8% | 4.2%(+12.6)#8 | 4.8%(+12.1)#526 |
| 9. | Fountain | 16.2% | 4.2%(+12.0)#9 | 4.8%(+11.4)#575 |
| 10. | Crystal | 15.8% | 4.2%(+11.6)#10 | 4.8%(+11.1)#611 |
| 11. | Bessemer | 15.5% | 4.2%(+11.3)#11 | 4.8%(+10.8)#638 |
| 12. | Interlochen | 15.4% | 4.2%(+11.2)#12 | 4.8%(+10.6)#655 |
| 13. | Winn | 14.8% | 4.2%(+10.5)#13 | 4.8%(+9.99)#725 |
| 14. | Norwood | 14.4% | 4.2%(+10.2)#14 | 4.8%(+9.68)#760 |
| 15. | West Ishpeming | 13.8% | 4.2%(+9.54)#15 | 4.8%(+9.00)#866 |
| 16. | Stanwood | 13.6% | 4.2%(+9.41)#16 | 4.8%(+8.87)#879 |
| 17. | Armada | 12.9% | 4.2%(+8.69)#17 | 4.8%(+8.15)#1,008 |
| 18. | Portland | 12.7% | 4.2%(+8.43)#18 | 4.8%(+7.89)#1,061 |
| 19. | Frankenmuth | 12.6% | 4.2%(+8.39)#19 | 4.8%(+7.85)#1,074 |
| 20. | Westphalia | 12.4% | 4.2%(+8.14)#20 | 4.8%(+7.60)#1,133 |
| 21. | Clarksville | 12.2% | 4.2%(+7.95)#21 | 4.8%(+7.40)#1,182 |
| 22. | Atlantic Mine | 12.1% | 4.2%(+7.84)#22 | 4.8%(+7.29)#1,214 |
| 23. | Shaftsburg | 11.5% | 4.2%(+7.26)#23 | 4.8%(+6.72)#1,366 |
| 24. | Fostoria | 11.1% | 4.2%(+6.91)#24 | 4.8%(+6.36)#1,478 |
| 25. | Grand Beach | 10.9% | 4.2%(+6.70)#25 | 4.8%(+6.16)#1,553 |
| 26. | Holt | 10.9% | 4.2%(+6.65)#26 | 4.8%(+6.11)#1,574 |
| 27. | Nessen City | 10.7% | 4.2%(+6.49)#27 | 4.8%(+5.95)#1,635 |
| 28. | Hartland | 10.6% | 4.2%(+6.37)#28 | 4.8%(+5.82)#1,669 |
| 29. | Orchard Lake Village | 10.5% | 4.2%(+6.32)#29 | 4.8%(+5.77)#1,689 |
| 30. | Edgemont Park | 10.4% | 4.2%(+6.22)#30 | 4.8%(+5.68)#1,723 |
| 31. | Chelsea | 10.3% | 4.2%(+6.07)#31 | 4.8%(+5.53)#1,778 |
| 32. | Rock | 10.1% | 4.2%(+5.89)#32 | 4.8%(+5.34)#1,860 |
| 33. | Filer City | 10.1% | 4.2%(+5.87)#33 | 4.8%(+5.32)#1,872 |
| 34. | Watersmeet | 10.1% | 4.2%(+5.86)#34 | 4.8%(+5.32)#1,874 |
| 35. | Lewiston | 10.1% | 4.2%(+5.85)#35 | 4.8%(+5.31)#1,879 |
| 36. | Bath | 9.9% | 4.2%(+5.69)#36 | 4.8%(+5.15)#1,950 |
| 37. | Waverly | 9.9% | 4.2%(+5.64)#37 | 4.8%(+5.09)#1,982 |
| 38. | Hillman | 9.8% | 4.2%(+5.56)#38 | 4.8%(+5.02)#2,020 |
| 39. | Baldwin | 9.6% | 4.2%(+5.38)#39 | 4.8%(+4.83)#2,111 |
| 40. | Grand Marais | 9.6% | 4.2%(+5.36)#40 | 4.8%(+4.82)#2,117 |
| 41. | Gladwin | 9.5% | 4.2%(+5.27)#41 | 4.8%(+4.72)#2,194 |
| 42. | Goodrich | 9.4% | 4.2%(+5.18)#42 | 4.8%(+4.64)#2,246 |
| 43. | Dewitt | 9.3% | 4.2%(+5.08)#43 | 4.8%(+4.54)#2,297 |
| 44. | Rochester | 9.2% | 4.2%(+4.96)#44 | 4.8%(+4.41)#2,373 |
| 45. | Leland | 9.1% | 4.2%(+4.87)#45 | 4.8%(+4.32)#2,417 |
| 46. | Mulliken | 8.9% | 4.2%(+4.70)#46 | 4.8%(+4.16)#2,528 |
| 47. | Rogers City | 8.7% | 4.2%(+4.53)#47 | 4.8%(+3.98)#2,649 |
| 48. | Lexington | 8.7% | 4.2%(+4.52)#48 | 4.8%(+3.98)#2,650 |
| 49. | Northville | 8.6% | 4.2%(+4.39)#49 | 4.8%(+3.85)#2,745 |
| 50. | Allen | 8.6% | 4.2%(+4.35)#50 | 4.8%(+3.80)#2,777 |
| 51. | Charlevoix | 8.6% | 4.2%(+4.34)#51 | 4.8%(+3.80)#2,782 |
| 52. | Lake Odessa | 8.5% | 4.2%(+4.28)#52 | 4.8%(+3.74)#2,828 |
| 53. | Tustin | 8.4% | 4.2%(+4.19)#53 | 4.8%(+3.64)#2,907 |
| 54. | Wacousta | 8.4% | 4.2%(+4.17)#54 | 4.8%(+3.63)#2,923 |
| 55. | Sunfield | 8.2% | 4.2%(+4.02)#55 | 4.8%(+3.48)#3,032 |
| 56. | Mattawan | 8.1% | 4.2%(+3.91)#56 | 4.8%(+3.36)#3,132 |
| 57. | Eagle | 8.1% | 4.2%(+3.84)#57 | 4.8%(+3.30)#3,181 |
| 58. | Richland | 8.0% | 4.2%(+3.82)#58 | 4.8%(+3.28)#3,197 |
| 59. | Stony Point | 8.0% | 4.2%(+3.81)#59 | 4.8%(+3.27)#3,206 |
| 60. | Vermontville | 8.0% | 4.2%(+3.80)#60 | 4.8%(+3.26)#3,212 |
| 61. | Lowell | 8.0% | 4.2%(+3.73)#61 | 4.8%(+3.19)#3,276 |
| 62. | Berkley | 7.9% | 4.2%(+3.70)#62 | 4.8%(+3.15)#3,322 |
| 63. | Bingham Farms | 7.9% | 4.2%(+3.63)#63 | 4.8%(+3.08)#3,386 |
| 64. | Birmingham | 7.8% | 4.2%(+3.62)#64 | 4.8%(+3.08)#3,392 |
| 65. | Port Sanilac | 7.8% | 4.2%(+3.60)#65 | 4.8%(+3.06)#3,409 |
| 66. | Ruby | 7.8% | 4.2%(+3.60)#66 | 4.8%(+3.05)#3,411 |
| 67. | Twin Lake | 7.8% | 4.2%(+3.56)#67 | 4.8%(+3.02)#3,438 |
| 68. | Forest Hills | 7.8% | 4.2%(+3.55)#68 | 4.8%(+3.01)#3,448 |
| 69. | Fremont | 7.8% | 4.2%(+3.53)#69 | 4.8%(+2.99)#3,472 |
| 70. | Argentine | 7.7% | 4.2%(+3.51)#70 | 4.8%(+2.96)#3,488 |
| 71. | Lake Fenton | 7.6% | 4.2%(+3.33)#71 | 4.8%(+2.79)#3,685 |
| 72. | Royal Oak | 7.5% | 4.2%(+3.31)#72 | 4.8%(+2.77)#3,706 |
| 73. | Snover | 7.5% | 4.2%(+3.30)#73 | 4.8%(+2.76)#3,714 |
| 74. | Iron Mountain | 7.5% | 4.2%(+3.23)#74 | 4.8%(+2.69)#3,780 |
| 75. | Grand Ledge | 7.4% | 4.2%(+3.16)#75 | 4.8%(+2.62)#3,855 |
| 76. | Caledonia | 7.4% | 4.2%(+3.14)#76 | 4.8%(+2.60)#3,873 |
| 77. | Dowling | 7.3% | 4.2%(+3.07)#77 | 4.8%(+2.53)#3,954 |
| 78. | Ferndale | 7.3% | 4.2%(+3.05)#78 | 4.8%(+2.51)#3,976 |
| 79. | Harbor Springs | 7.3% | 4.2%(+3.04)#79 | 4.8%(+2.50)#3,985 |
| 80. | South Rockwood | 7.3% | 4.2%(+3.04)#80 | 4.8%(+2.49)#3,992 |
| 81. | Fowler | 7.2% | 4.2%(+2.99)#81 | 4.8%(+2.45)#4,044 |
| 82. | Grosse Pointe Woods | 7.2% | 4.2%(+2.98)#82 | 4.8%(+2.44)#4,061 |
| 83. | Oak Park | 7.2% | 4.2%(+2.97)#83 | 4.8%(+2.42)#4,073 |
| 84. | Dollar Bay | 7.2% | 4.2%(+2.96)#84 | 4.8%(+2.41)#4,080 |
| 85. | Haslett | 7.2% | 4.2%(+2.93)#85 | 4.8%(+2.39)#4,107 |
| 86. | Pewamo | 7.1% | 4.2%(+2.92)#86 | 4.8%(+2.38)#4,127 |
| 87. | Lost Lake Woods | 7.1% | 4.2%(+2.92)#87 | 4.8%(+2.38)#4,129 |
| 88. | Chassell | 7.1% | 4.2%(+2.90)#88 | 4.8%(+2.36)#4,167 |
| 89. | Keego Harbor | 7.1% | 4.2%(+2.90)#89 | 4.8%(+2.35)#4,169 |
| 90. | Westwood | 7.1% | 4.2%(+2.89)#90 | 4.8%(+2.34)#4,185 |
| 91. | Perry | 7.1% | 4.2%(+2.86)#91 | 4.8%(+2.32)#4,209 |
| 92. | Pleasant Ridge | 7.1% | 4.2%(+2.86)#92 | 4.8%(+2.32)#4,212 |
| 93. | Belleville | 7.1% | 4.2%(+2.84)#93 | 4.8%(+2.30)#4,233 |
| 94. | Lake Orion | 7.0% | 4.2%(+2.82)#94 | 4.8%(+2.27)#4,271 |
| 95. | Dimondale | 7.0% | 4.2%(+2.77)#95 | 4.8%(+2.23)#4,329 |
| 96. | Climax | 7.0% | 4.2%(+2.77)#96 | 4.8%(+2.23)#4,335 |
| 97. | Clawson | 6.9% | 4.2%(+2.66)#97 | 4.8%(+2.12)#4,479 |
| 98. | Bellevue | 6.9% | 4.2%(+2.66)#98 | 4.8%(+2.12)#4,482 |
| 99. | Farmington Hills | 6.8% | 4.2%(+2.61)#99 | 4.8%(+2.07)#4,546 |
| 100. | Eau Claire | 6.8% | 4.2%(+2.55)#100 | 4.8%(+2.01)#4,634 |
Common Questions
What are the Top 10 Cities with the Highest Percentage of Population Employed in Finance & Insurance in Michigan?
Top 10 Cities with the Highest Percentage of Population Employed in Finance & Insurance in Michigan are:
#1
30.0%
#2
17.8%
#3
17.6%
#4
17.2%
#5
16.8%
#6
16.2%
#7
15.5%
#8
15.4%
#9
14.4%
#10
13.8%
What city has the Highest Percentage of Population Employed in Finance & Insurance in Michigan?
Crystal Downs Country Club has the Highest Percentage of Population Employed in Finance & Insurance in Michigan with 30.0%.
What is the Percentage of Population Employed in Finance & Insurance in the State of Michigan?
Percentage of Population Employed in Finance & Insurance in Michigan is 4.2%.
What is the Percentage of Population Employed in Finance & Insurance in the United States?
Percentage of Population Employed in Finance & Insurance in the United States is 4.8%.