Cities with the Highest Percentage of Population Employed in Construction & Extraction in Michigan
RELATED REPORTS & OPTIONS
Construction & Extraction
Michigan
Compare Cities
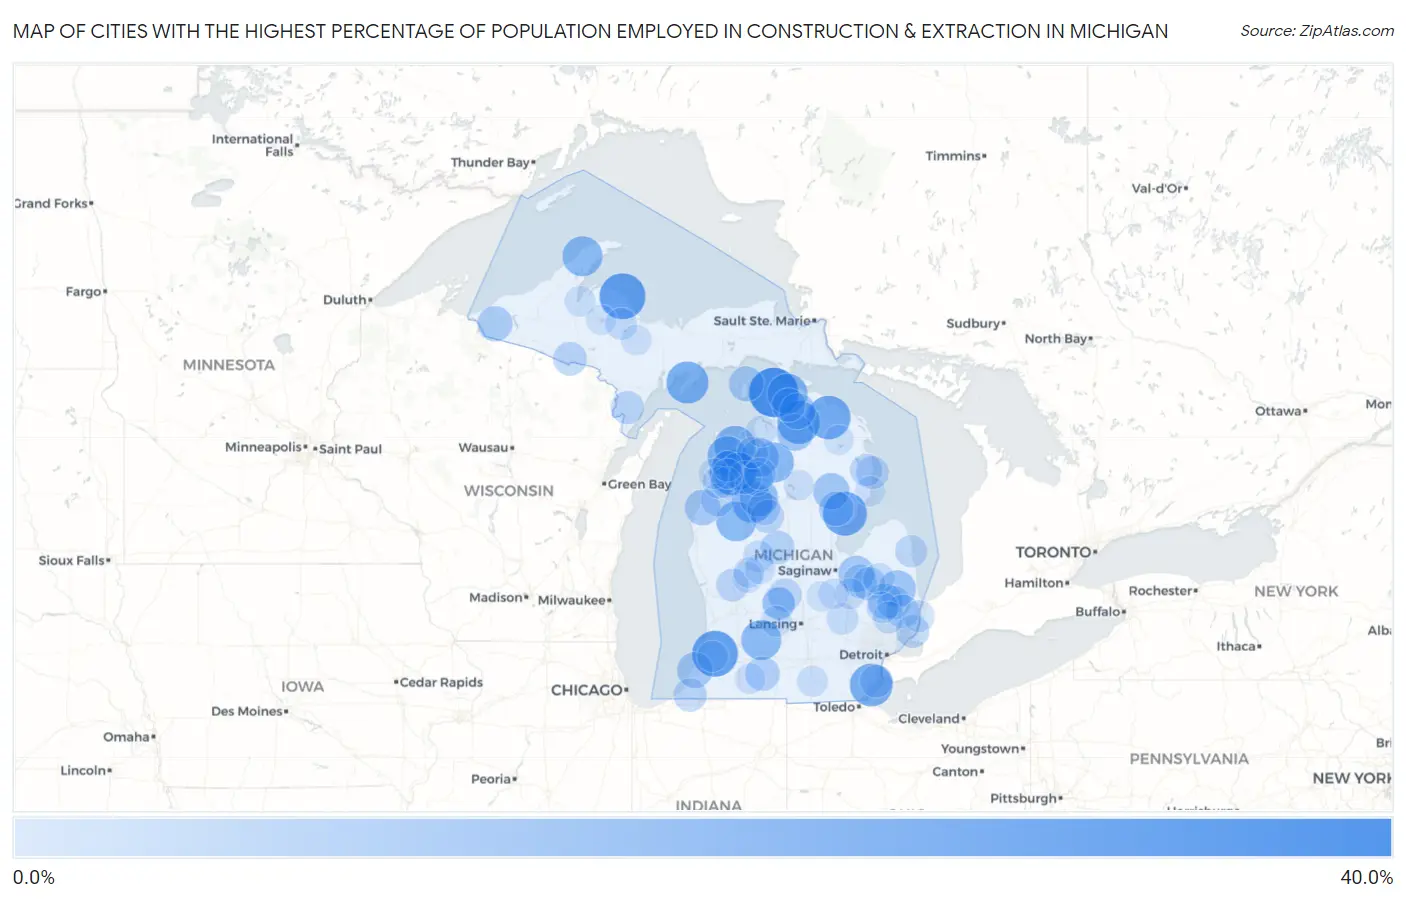
Map of Cities with the Highest Percentage of Population Employed in Construction & Extraction in Michigan
0.0%
40.0%
Cities with the Highest Percentage of Population Employed in Construction & Extraction in Michigan
| City | % Employed | vs State | vs National | |
| 1. | Cross Village | 31.2% | 4.4%(+26.9)#1 | 5.0%(+26.3)#495 |
| 2. | Big Bay | 27.2% | 4.4%(+22.8)#2 | 5.0%(+22.2)#698 |
| 3. | Breedsville | 27.0% | 4.4%(+22.7)#3 | 5.0%(+22.0)#709 |
| 4. | Interlochen | 26.7% | 4.4%(+22.3)#4 | 5.0%(+21.7)#735 |
| 5. | Turner | 25.0% | 4.4%(+20.6)#5 | 5.0%(+20.0)#839 |
| 6. | Millersburg | 24.5% | 4.4%(+20.1)#6 | 5.0%(+19.5)#880 |
| 7. | Woodland Beach | 23.7% | 4.4%(+19.3)#7 | 5.0%(+18.7)#953 |
| 8. | Wolverine | 23.7% | 4.4%(+19.3)#8 | 5.0%(+18.7)#954 |
| 9. | Garden | 22.9% | 4.4%(+18.5)#9 | 5.0%(+17.9)#1,029 |
| 10. | Lake Leelanau | 21.7% | 4.4%(+17.3)#10 | 5.0%(+16.7)#1,172 |
| 11. | Haring | 21.2% | 4.4%(+16.8)#11 | 5.0%(+16.2)#1,219 |
| 12. | Levering | 20.8% | 4.4%(+16.5)#12 | 5.0%(+15.8)#1,269 |
| 13. | Manistee Lake | 20.8% | 4.4%(+16.4)#13 | 5.0%(+15.8)#1,273 |
| 14. | Barnes Lake | 20.8% | 4.4%(+16.4)#14 | 5.0%(+15.8)#1,274 |
| 15. | Maple City | 20.7% | 4.4%(+16.3)#15 | 5.0%(+15.7)#1,290 |
| 16. | Ahmeek | 20.5% | 4.4%(+16.1)#16 | 5.0%(+15.5)#1,315 |
| 17. | Dowling | 20.4% | 4.4%(+16.1)#17 | 5.0%(+15.4)#1,318 |
| 18. | Luther | 20.4% | 4.4%(+16.0)#18 | 5.0%(+15.4)#1,326 |
| 19. | Jennings | 18.8% | 4.4%(+14.5)#19 | 5.0%(+13.8)#1,568 |
| 20. | Mohawk | 18.6% | 4.4%(+14.3)#20 | 5.0%(+13.6)#1,600 |
| 21. | Rapid City | 18.4% | 4.4%(+14.1)#21 | 5.0%(+13.4)#1,640 |
| 22. | Chums Corner | 17.8% | 4.4%(+13.5)#22 | 5.0%(+12.8)#1,774 |
| 23. | Melvin | 17.1% | 4.4%(+12.7)#23 | 5.0%(+12.1)#1,939 |
| 24. | Vanderbilt | 16.7% | 4.4%(+12.4)#24 | 5.0%(+11.7)#2,017 |
| 25. | Lupton | 16.5% | 4.4%(+12.1)#25 | 5.0%(+11.5)#2,105 |
| 26. | Vassar | 16.2% | 4.4%(+11.8)#26 | 5.0%(+11.2)#2,191 |
| 27. | Indian River | 16.1% | 4.4%(+11.7)#27 | 5.0%(+11.1)#2,224 |
| 28. | Benton Heights | 15.8% | 4.4%(+11.5)#28 | 5.0%(+10.9)#2,284 |
| 29. | Filer City | 15.6% | 4.4%(+11.2)#29 | 5.0%(+10.6)#2,357 |
| 30. | Skanee | 15.4% | 4.4%(+11.0)#30 | 5.0%(+10.4)#2,418 |
| 31. | Imlay City | 15.3% | 4.4%(+10.9)#31 | 5.0%(+10.3)#2,458 |
| 32. | Wakefield | 15.1% | 4.4%(+10.7)#32 | 5.0%(+10.1)#2,514 |
| 33. | St James | 15.0% | 4.4%(+10.6)#33 | 5.0%(+10.0)#2,546 |
| 34. | Prescott | 14.7% | 4.4%(+10.3)#34 | 5.0%(+9.66)#2,683 |
| 35. | Shaftsburg | 14.5% | 4.4%(+10.2)#35 | 5.0%(+9.53)#2,737 |
| 36. | Athens | 14.2% | 4.4%(+9.87)#36 | 5.0%(+9.24)#2,840 |
| 37. | Fife Lake | 14.1% | 4.4%(+9.76)#37 | 5.0%(+9.13)#2,869 |
| 38. | Weidman | 13.6% | 4.4%(+9.28)#38 | 5.0%(+8.65)#3,076 |
| 39. | Millington | 13.6% | 4.4%(+9.19)#39 | 5.0%(+8.56)#3,121 |
| 40. | Gaastra | 13.5% | 4.4%(+9.10)#40 | 5.0%(+8.47)#3,160 |
| 41. | Capac | 13.4% | 4.4%(+9.06)#41 | 5.0%(+8.43)#3,181 |
| 42. | Brutus | 13.4% | 4.4%(+9.02)#42 | 5.0%(+8.39)#3,198 |
| 43. | Rapid River | 13.4% | 4.4%(+9.01)#43 | 5.0%(+8.39)#3,201 |
| 44. | Fostoria | 13.2% | 4.4%(+8.84)#44 | 5.0%(+8.21)#3,276 |
| 45. | Memphis | 13.2% | 4.4%(+8.83)#45 | 5.0%(+8.21)#3,284 |
| 46. | Kingsley | 13.2% | 4.4%(+8.83)#46 | 5.0%(+8.20)#3,287 |
| 47. | Greenland | 13.2% | 4.4%(+8.79)#47 | 5.0%(+8.16)#3,307 |
| 48. | Galien | 13.1% | 4.4%(+8.71)#48 | 5.0%(+8.08)#3,345 |
| 49. | Marion | 13.1% | 4.4%(+8.70)#49 | 5.0%(+8.07)#3,348 |
| 50. | Pearl Beach | 13.0% | 4.4%(+8.65)#50 | 5.0%(+8.03)#3,383 |
| 51. | Hubbardston | 13.0% | 4.4%(+8.65)#51 | 5.0%(+8.02)#3,388 |
| 52. | Daggett | 13.0% | 4.4%(+8.62)#52 | 5.0%(+7.99)#3,397 |
| 53. | Brethren | 12.9% | 4.4%(+8.51)#53 | 5.0%(+7.88)#3,448 |
| 54. | Mcbain | 12.8% | 4.4%(+8.44)#54 | 5.0%(+7.81)#3,488 |
| 55. | Harrisville | 12.7% | 4.4%(+8.36)#55 | 5.0%(+7.73)#3,525 |
| 56. | Riverdale | 12.7% | 4.4%(+8.33)#56 | 5.0%(+7.70)#3,540 |
| 57. | Estral Beach | 12.6% | 4.4%(+8.26)#57 | 5.0%(+7.63)#3,564 |
| 58. | Kent City | 12.5% | 4.4%(+8.12)#58 | 5.0%(+7.49)#3,662 |
| 59. | Muir | 12.5% | 4.4%(+8.09)#59 | 5.0%(+7.46)#3,675 |
| 60. | Lyons | 12.2% | 4.4%(+7.87)#60 | 5.0%(+7.25)#3,784 |
| 61. | Lincoln | 12.2% | 4.4%(+7.83)#61 | 5.0%(+7.20)#3,814 |
| 62. | Three Lakes | 12.1% | 4.4%(+7.76)#62 | 5.0%(+7.13)#3,855 |
| 63. | Forestville | 12.1% | 4.4%(+7.76)#63 | 5.0%(+7.13)#3,857 |
| 64. | Cambria | 11.9% | 4.4%(+7.56)#64 | 5.0%(+6.93)#3,974 |
| 65. | Crystal Mountain | 11.8% | 4.4%(+7.40)#65 | 5.0%(+6.77)#4,092 |
| 66. | West Ishpeming | 11.6% | 4.4%(+7.24)#66 | 5.0%(+6.61)#4,203 |
| 67. | Ida | 11.6% | 4.4%(+7.20)#67 | 5.0%(+6.58)#4,220 |
| 68. | South Boardman | 11.4% | 4.4%(+7.07)#68 | 5.0%(+6.44)#4,308 |
| 69. | Romeo | 11.4% | 4.4%(+7.07)#69 | 5.0%(+6.44)#4,309 |
| 70. | Argentine | 11.4% | 4.4%(+6.98)#70 | 5.0%(+6.36)#4,376 |
| 71. | St Clair | 11.3% | 4.4%(+6.96)#71 | 5.0%(+6.33)#4,396 |
| 72. | Mears | 11.3% | 4.4%(+6.91)#72 | 5.0%(+6.28)#4,435 |
| 73. | Dryden | 11.2% | 4.4%(+6.85)#73 | 5.0%(+6.22)#4,480 |
| 74. | Clifford | 11.2% | 4.4%(+6.84)#74 | 5.0%(+6.21)#4,485 |
| 75. | Canadian Lakes | 11.1% | 4.4%(+6.78)#75 | 5.0%(+6.15)#4,536 |
| 76. | Lamont | 11.1% | 4.4%(+6.76)#76 | 5.0%(+6.14)#4,552 |
| 77. | Elk Rapids | 10.9% | 4.4%(+6.52)#77 | 5.0%(+5.89)#4,753 |
| 78. | Bangor | 10.9% | 4.4%(+6.50)#78 | 5.0%(+5.87)#4,775 |
| 79. | Sunfield | 10.8% | 4.4%(+6.39)#79 | 5.0%(+5.76)#4,853 |
| 80. | Nessen City | 10.7% | 4.4%(+6.35)#80 | 5.0%(+5.72)#4,899 |
| 81. | Ellsworth | 10.6% | 4.4%(+6.27)#81 | 5.0%(+5.64)#4,959 |
| 82. | Bergland | 10.6% | 4.4%(+6.27)#82 | 5.0%(+5.64)#4,964 |
| 83. | Mount Morris | 10.6% | 4.4%(+6.25)#83 | 5.0%(+5.62)#4,975 |
| 84. | Addison | 10.5% | 4.4%(+6.16)#84 | 5.0%(+5.53)#5,039 |
| 85. | Painesdale | 10.5% | 4.4%(+6.16)#85 | 5.0%(+5.53)#5,043 |
| 86. | L Anse | 10.3% | 4.4%(+5.97)#86 | 5.0%(+5.34)#5,242 |
| 87. | Mendon | 10.3% | 4.4%(+5.91)#87 | 5.0%(+5.28)#5,287 |
| 88. | New Lothrop | 10.3% | 4.4%(+5.91)#88 | 5.0%(+5.28)#5,291 |
| 89. | Beulah | 10.2% | 4.4%(+5.84)#89 | 5.0%(+5.21)#5,348 |
| 90. | Pierson | 10.2% | 4.4%(+5.84)#90 | 5.0%(+5.21)#5,350 |
| 91. | Howard City | 10.2% | 4.4%(+5.83)#91 | 5.0%(+5.21)#5,354 |
| 92. | Lakeview | 10.2% | 4.4%(+5.81)#92 | 5.0%(+5.19)#5,364 |
| 93. | Gwinn | 10.2% | 4.4%(+5.79)#93 | 5.0%(+5.16)#5,394 |
| 94. | Roscommon | 10.1% | 4.4%(+5.72)#94 | 5.0%(+5.09)#5,456 |
| 95. | Oscoda | 10.1% | 4.4%(+5.70)#95 | 5.0%(+5.07)#5,482 |
| 96. | Lake Ann | 10.0% | 4.4%(+5.63)#96 | 5.0%(+5.01)#5,538 |
| 97. | Henderson | 9.9% | 4.4%(+5.57)#97 | 5.0%(+4.94)#5,629 |
| 98. | Michigamme | 9.9% | 4.4%(+5.49)#98 | 5.0%(+4.87)#5,708 |
| 99. | Hillman | 9.8% | 4.4%(+5.42)#99 | 5.0%(+4.79)#5,768 |
| 100. | Bendon | 9.8% | 4.4%(+5.42)#100 | 5.0%(+4.79)#5,772 |
Common Questions
What are the Top 10 Cities with the Highest Percentage of Population Employed in Construction & Extraction in Michigan?
Top 10 Cities with the Highest Percentage of Population Employed in Construction & Extraction in Michigan are:
#1
31.2%
#2
27.2%
#3
27.0%
#4
26.7%
#5
25.0%
#6
24.5%
#7
23.7%
#8
23.7%
#9
22.9%
#10
21.7%
What city has the Highest Percentage of Population Employed in Construction & Extraction in Michigan?
Cross Village has the Highest Percentage of Population Employed in Construction & Extraction in Michigan with 31.2%.
What is the Percentage of Population Employed in Construction & Extraction in the State of Michigan?
Percentage of Population Employed in Construction & Extraction in Michigan is 4.4%.
What is the Percentage of Population Employed in Construction & Extraction in the United States?
Percentage of Population Employed in Construction & Extraction in the United States is 5.0%.