Zip Codes with the Highest Percentage of Population Employed in Sales & Related in Brighton, MI
RELATED REPORTS & OPTIONS
Sales & Related
Brighton
Compare Zip Codes
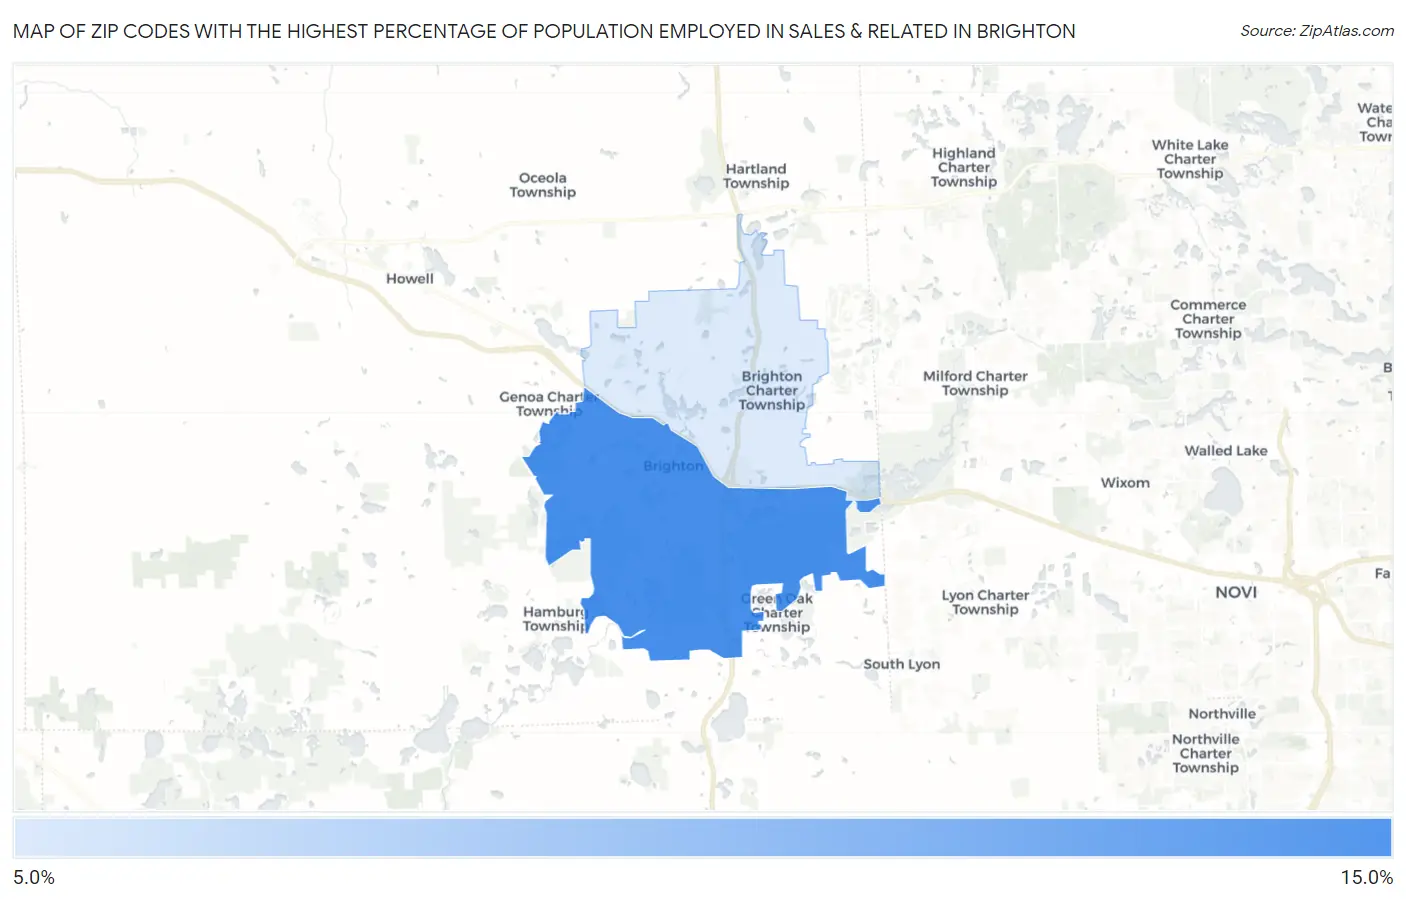
Map of Zip Codes with the Highest Percentage of Population Employed in Sales & Related in Brighton
12.0%
14.3%
Zip Codes with the Highest Percentage of Population Employed in Sales & Related in Brighton, MI
| Zip Code | % Employed | vs State | vs National | |
| 1. | 48116 | 14.3% | 9.1%(+5.17)#68 | 9.6%(+4.71)#3,227 |
| 2. | 48114 | 12.0% | 9.1%(+2.88)#149 | 9.6%(+2.42)#6,009 |
1
Common Questions
What are the Top Zip Codes with the Highest Percentage of Population Employed in Sales & Related in Brighton, MI?
Top Zip Codes with the Highest Percentage of Population Employed in Sales & Related in Brighton, MI are:
What zip code has the Highest Percentage of Population Employed in Sales & Related in Brighton, MI?
48116 has the Highest Percentage of Population Employed in Sales & Related in Brighton, MI with 14.3%.
What is the Percentage of Population Employed in Sales & Related in Brighton, MI?
Percentage of Population Employed in Sales & Related in Brighton is 16.4%.
What is the Percentage of Population Employed in Sales & Related in Michigan?
Percentage of Population Employed in Sales & Related in Michigan is 9.1%.
What is the Percentage of Population Employed in Sales & Related in the United States?
Percentage of Population Employed in Sales & Related in the United States is 9.6%.