Zip Codes with the Highest Percentage of Population Employed in Transportation & Warehousing in Brighton, MI
RELATED REPORTS & OPTIONS
Transportation & Warehousing
Brighton
Compare Zip Codes
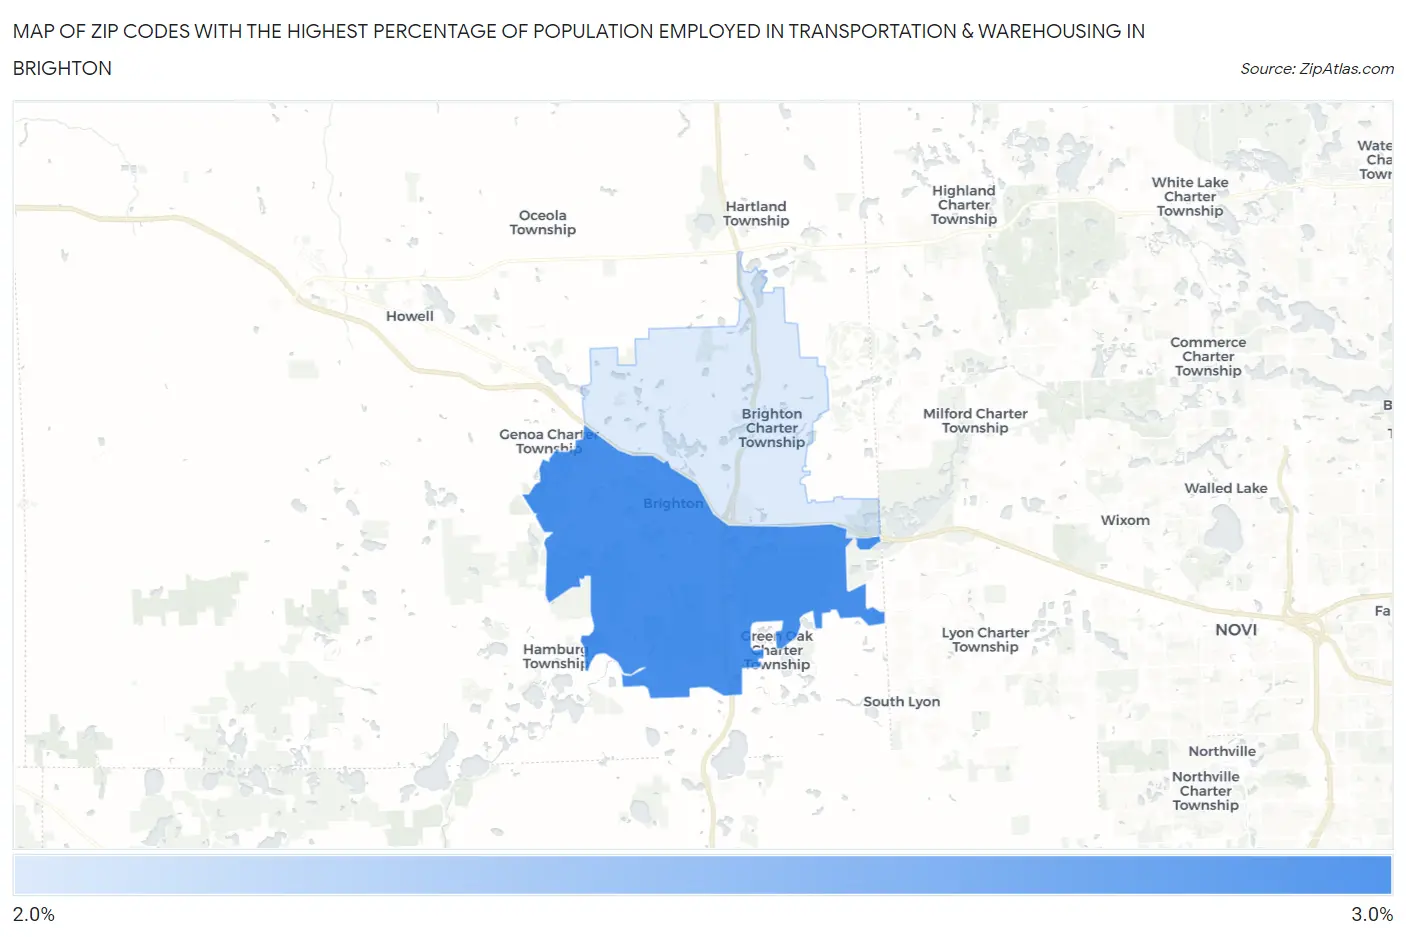
Map of Zip Codes with the Highest Percentage of Population Employed in Transportation & Warehousing in Brighton
0.0%
3.0%
Zip Codes with the Highest Percentage of Population Employed in Transportation & Warehousing in Brighton, MI
| Zip Code | % Employed | vs State | vs National | |
| 1. | 48116 | 2.6% | 3.9%(-1.29)#662 | 4.9%(-2.33)#21,891 |
| 2. | 48114 | 2.1% | 3.9%(-1.77)#760 | 4.9%(-2.81)#23,808 |
1
Common Questions
What are the Top Zip Codes with the Highest Percentage of Population Employed in Transportation & Warehousing in Brighton, MI?
Top Zip Codes with the Highest Percentage of Population Employed in Transportation & Warehousing in Brighton, MI are:
What zip code has the Highest Percentage of Population Employed in Transportation & Warehousing in Brighton, MI?
48116 has the Highest Percentage of Population Employed in Transportation & Warehousing in Brighton, MI with 2.6%.
What is the Percentage of Population Employed in Transportation & Warehousing in Brighton, MI?
Percentage of Population Employed in Transportation & Warehousing in Brighton is 0.77%.
What is the Percentage of Population Employed in Transportation & Warehousing in Michigan?
Percentage of Population Employed in Transportation & Warehousing in Michigan is 3.9%.
What is the Percentage of Population Employed in Transportation & Warehousing in the United States?
Percentage of Population Employed in Transportation & Warehousing in the United States is 4.9%.