Zip Codes with the Highest Percentage of Population Employed in Farming, Fishing & Forestry in Brighton, MI
RELATED REPORTS & OPTIONS
Farming, Fishing & Forestry
Brighton
Compare Zip Codes
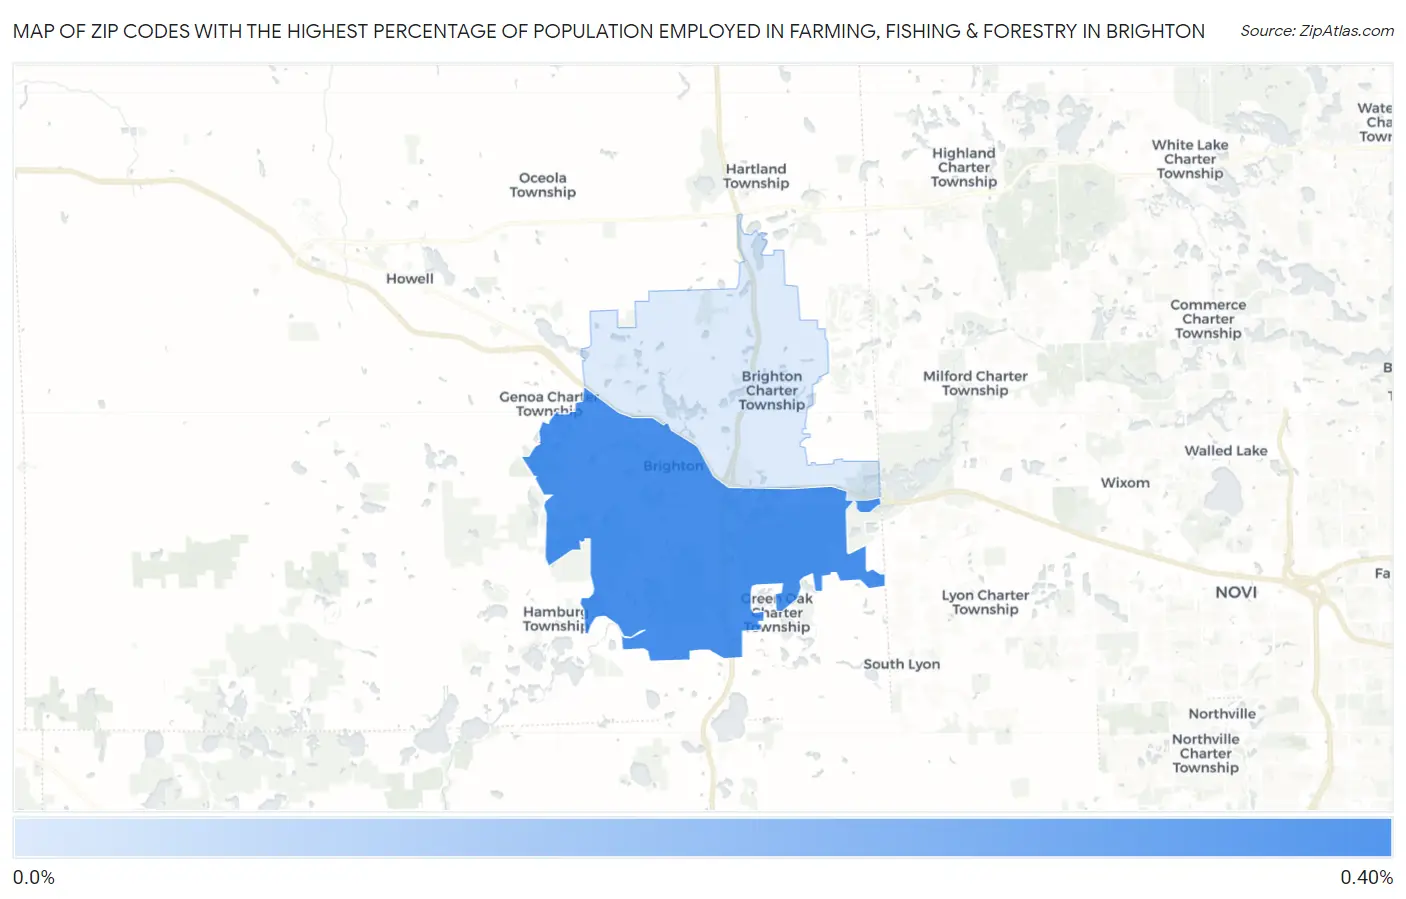
Map of Zip Codes with the Highest Percentage of Population Employed in Farming, Fishing & Forestry in Brighton
0.0%
0.40%
Zip Codes with the Highest Percentage of Population Employed in Farming, Fishing & Forestry in Brighton, MI
| Zip Code | % Employed | vs State | vs National | |
| 1. | 48116 | 0.35% | 0.47%(-0.120)#485 | 0.61%(-0.259)#14,303 |
| 2. | 48114 | 0.037% | 0.47%(-0.430)#678 | 0.61%(-0.569)#18,860 |
1
Common Questions
What are the Top Zip Codes with the Highest Percentage of Population Employed in Farming, Fishing & Forestry in Brighton, MI?
Top Zip Codes with the Highest Percentage of Population Employed in Farming, Fishing & Forestry in Brighton, MI are:
What zip code has the Highest Percentage of Population Employed in Farming, Fishing & Forestry in Brighton, MI?
48116 has the Highest Percentage of Population Employed in Farming, Fishing & Forestry in Brighton, MI with 0.35%.
What is the Percentage of Population Employed in Farming, Fishing & Forestry in Brighton, MI?
Percentage of Population Employed in Farming, Fishing & Forestry in Brighton is 0.60%.
What is the Percentage of Population Employed in Farming, Fishing & Forestry in Michigan?
Percentage of Population Employed in Farming, Fishing & Forestry in Michigan is 0.47%.
What is the Percentage of Population Employed in Farming, Fishing & Forestry in the United States?
Percentage of Population Employed in Farming, Fishing & Forestry in the United States is 0.61%.