Zip Codes with the Highest Percentage of Households Heated by Utility Gas in Bay City, MI
RELATED REPORTS & OPTIONS
Utility Gas Heating
Bay City
Compare Zip Codes
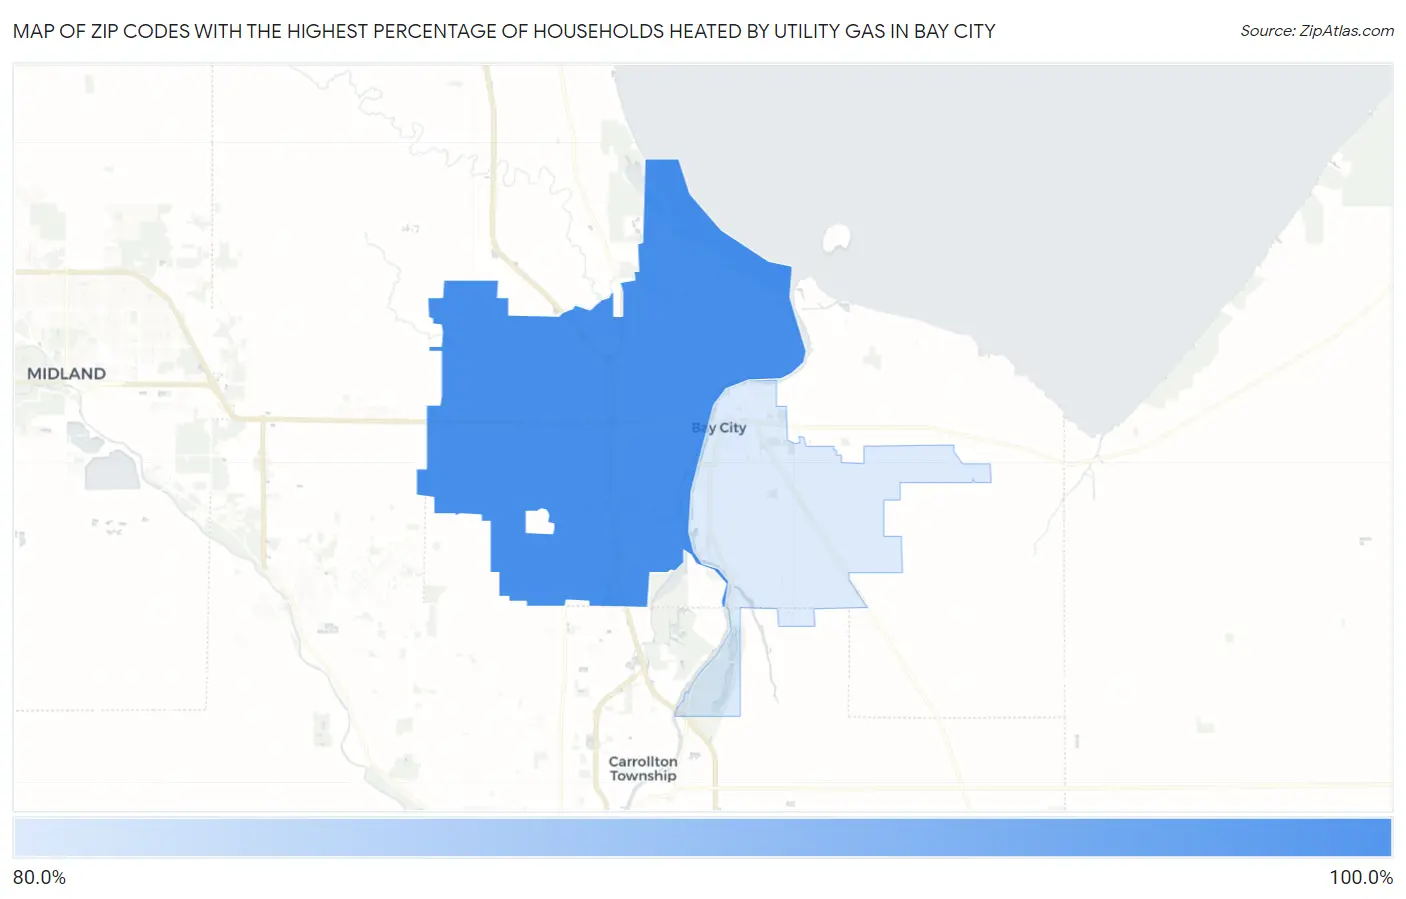
Map of Zip Codes with the Highest Percentage of Households Heated by Utility Gas in Bay City
0.0%
100.0%
Zip Codes with the Highest Percentage of Households Heated by Utility Gas in Bay City, MI
| Zip Code | Utility Gas Heating | vs State | vs National | |
| 1. | 48706 | 86.1% | 75.6%(+10.5)#177 | 47.1%(+39.0)#1,148 |
| 2. | 48708 | 85.7% | 75.6%(+10.1)#188 | 47.1%(+38.6)#1,205 |
1
Common Questions
What are the Top Zip Codes with the Highest Percentage of Households Heated by Utility Gas in Bay City, MI?
Top Zip Codes with the Highest Percentage of Households Heated by Utility Gas in Bay City, MI are:
What zip code has the Highest Percentage of Households Heated by Utility Gas in Bay City, MI?
48706 has the Highest Percentage of Households Heated by Utility Gas in Bay City, MI with 86.1%.
What is the Percentage of Households Heated by Utility Gas in Bay City, MI?
Percentage of Households Heated by Utility Gas in Bay City is 87.2%.
What is the Percentage of Households Heated by Utility Gas in Michigan?
Percentage of Households Heated by Utility Gas in Michigan is 75.6%.
What is the Percentage of Households Heated by Utility Gas in the United States?
Percentage of Households Heated by Utility Gas in the United States is 47.1%.