Kittery Point, ME
Kittery Point Map
Kittery Point Overview
1,017
TOTAL POPULATION
462
MALE POPULATION
555
FEMALE POPULATION
83.24
MALES / 100 FEMALES
120.13
FEMALES / 100 MALES
52.4
MEDIAN AGE
2.4
AVG FAMILY SIZE
2.1
AVG HOUSEHOLD SIZE
$50,833
PER CAPITA INCOME
$130,818
AVG FAMILY INCOME
$121,042
AVG HOUSEHOLD INCOME
37.4%
WAGE / INCOME GAP [ % ]
62.6¢/ $1
WAGE / INCOME GAP [ $ ]
0.28
INEQUALITY / GINI INDEX
632
LABOR FORCE [ PEOPLE ]
66.5%
PERCENT IN LABOR FORCE
0.9%
UNEMPLOYMENT RATE
Kittery Point Zip Codes
Kittery Point Area Codes
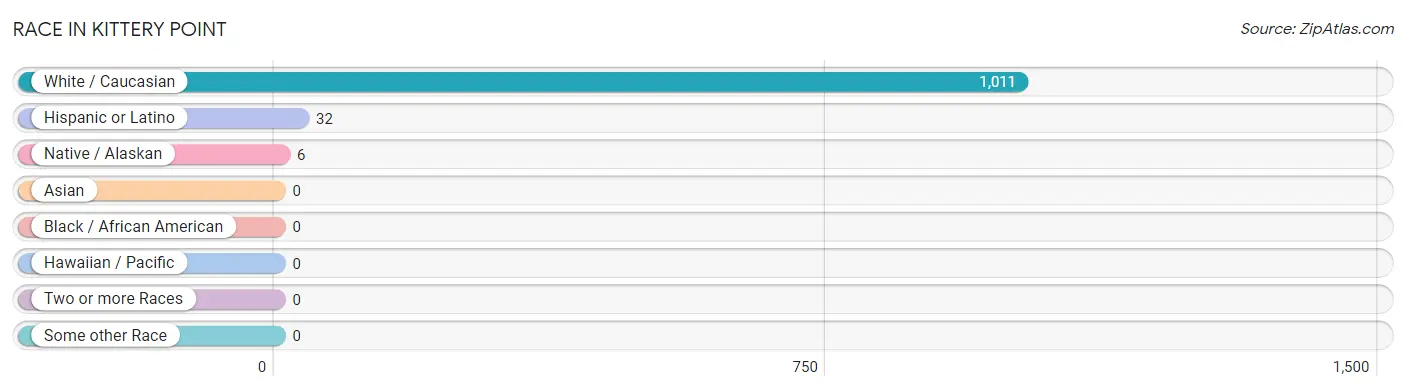
Race in Kittery Point
The most populous races in Kittery Point are White / Caucasian (1,011 | 99.4%), Hispanic or Latino (32 | 3.2%), and Native / Alaskan (6 | 0.6%).
| Race | # Population | % Population |
| Asian | 0 | 0.0% |
| Black / African American | 0 | 0.0% |
| Hawaiian / Pacific | 0 | 0.0% |
| Hispanic or Latino | 32 | 3.2% |
| Native / Alaskan | 6 | 0.6% |
| White / Caucasian | 1,011 | 99.4% |
| Two or more Races | 0 | 0.0% |
| Some other Race | 0 | 0.0% |
| Total | 1,017 | 100.0% |
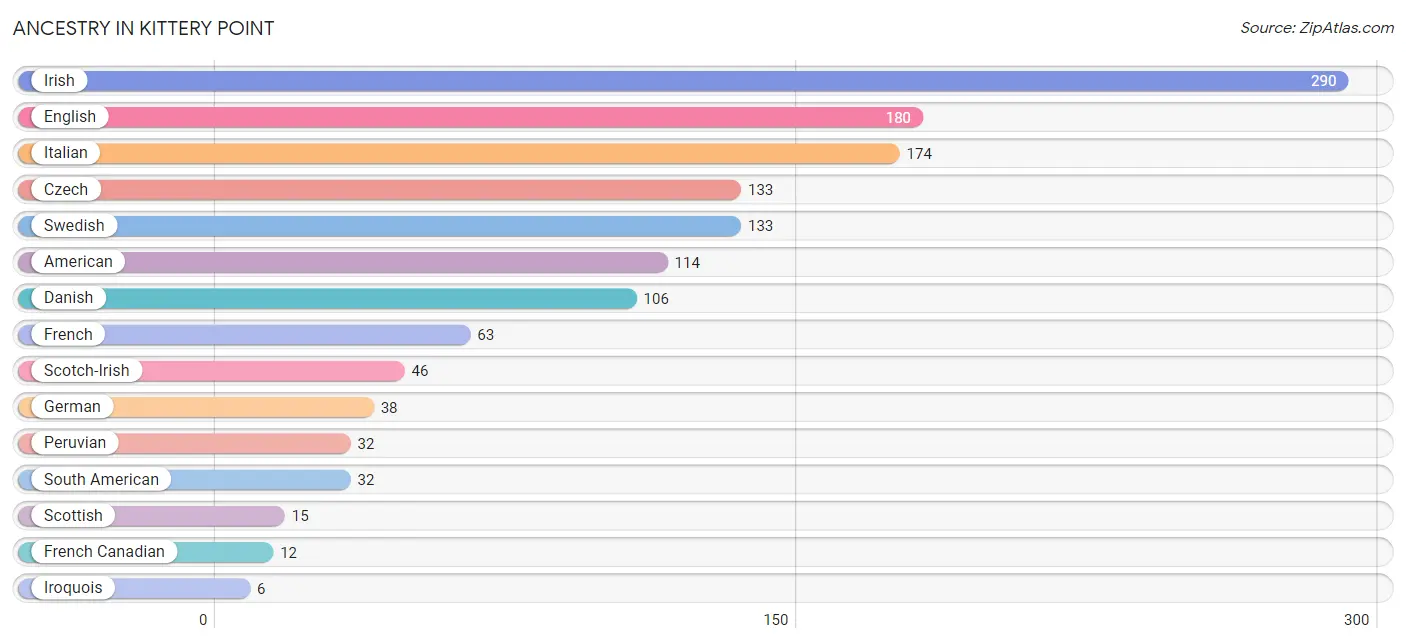
Ancestry in Kittery Point
The most populous ancestries reported in Kittery Point are Irish (290 | 28.5%), English (180 | 17.7%), Italian (174 | 17.1%), Czech (133 | 13.1%), and Swedish (133 | 13.1%), together accounting for 89.5% of all Kittery Point residents.
| Ancestry | # Population | % Population |
| American | 114 | 11.2% |
| Czech | 133 | 13.1% |
| Danish | 106 | 10.4% |
| English | 180 | 17.7% |
| French | 63 | 6.2% |
| French Canadian | 12 | 1.2% |
| German | 38 | 3.7% |
| Irish | 290 | 28.5% |
| Iroquois | 6 | 0.6% |
| Italian | 174 | 17.1% |
| Peruvian | 32 | 3.2% |
| Scotch-Irish | 46 | 4.5% |
| Scottish | 15 | 1.5% |
| South American | 32 | 3.2% |
| Swedish | 133 | 13.1% | View All 15 Rows |
Immigrants in Kittery Point

| Immigration Origin | # Population | % Population | View All 0 Rows |
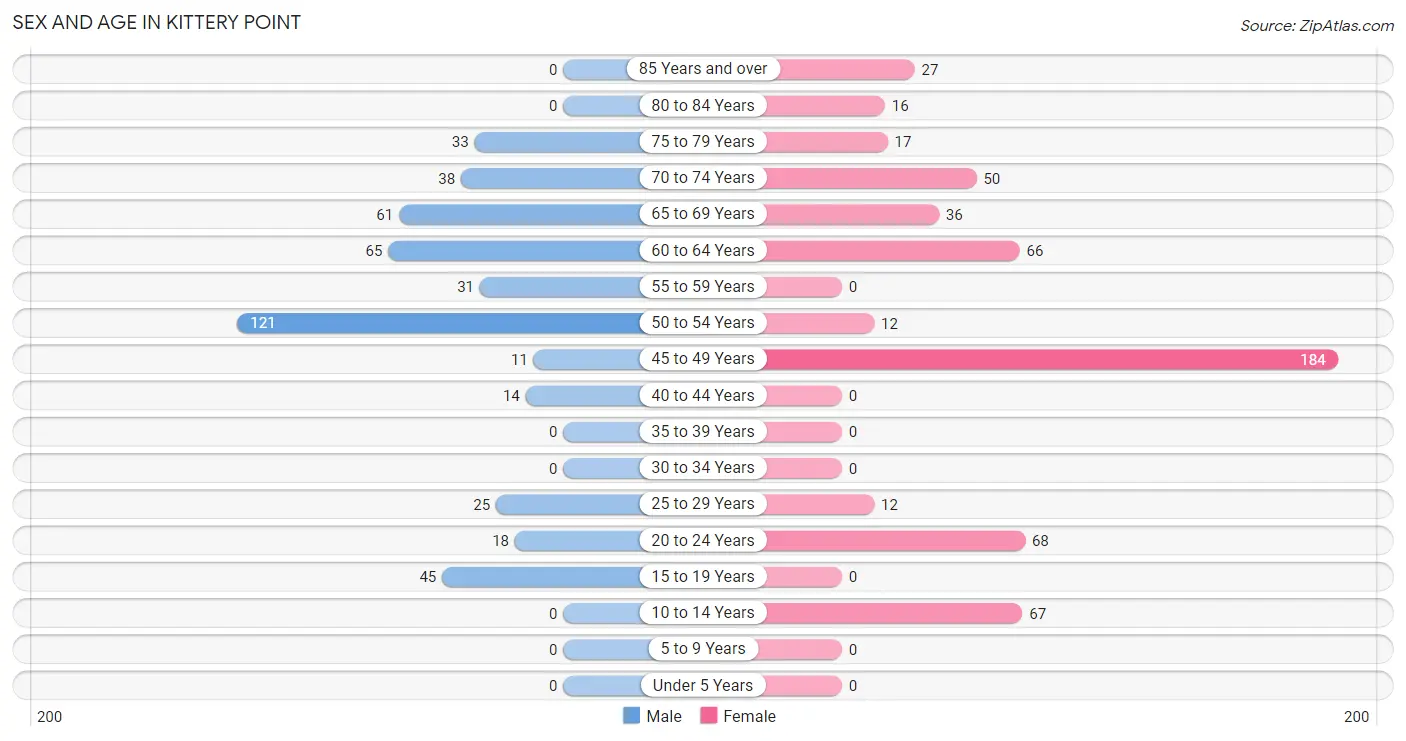
Sex and Age in Kittery Point
Sex and Age in Kittery Point
The most populous age groups in Kittery Point are 50 to 54 Years (121 | 26.2%) for men and 45 to 49 Years (184 | 33.2%) for women.
| Age Bracket | Male | Female |
| Under 5 Years | 0 (0.0%) | 0 (0.0%) |
| 5 to 9 Years | 0 (0.0%) | 0 (0.0%) |
| 10 to 14 Years | 0 (0.0%) | 67 (12.1%) |
| 15 to 19 Years | 45 (9.7%) | 0 (0.0%) |
| 20 to 24 Years | 18 (3.9%) | 68 (12.2%) |
| 25 to 29 Years | 25 (5.4%) | 12 (2.2%) |
| 30 to 34 Years | 0 (0.0%) | 0 (0.0%) |
| 35 to 39 Years | 0 (0.0%) | 0 (0.0%) |
| 40 to 44 Years | 14 (3.0%) | 0 (0.0%) |
| 45 to 49 Years | 11 (2.4%) | 184 (33.2%) |
| 50 to 54 Years | 121 (26.2%) | 12 (2.2%) |
| 55 to 59 Years | 31 (6.7%) | 0 (0.0%) |
| 60 to 64 Years | 65 (14.1%) | 66 (11.9%) |
| 65 to 69 Years | 61 (13.2%) | 36 (6.5%) |
| 70 to 74 Years | 38 (8.2%) | 50 (9.0%) |
| 75 to 79 Years | 33 (7.1%) | 17 (3.1%) |
| 80 to 84 Years | 0 (0.0%) | 16 (2.9%) |
| 85 Years and over | 0 (0.0%) | 27 (4.9%) |
| Total | 462 (100.0%) | 555 (100.0%) |
Families and Households in Kittery Point
Median Family Size in Kittery Point
The median family size in Kittery Point is 2.36 persons per family, with married-couple families (281 | 81.5%) accounting for the largest median family size of 2.42 persons per family. On the other hand, single female/mother families (17 | 4.9%) represent the smallest median family size with 2.00 persons per family.
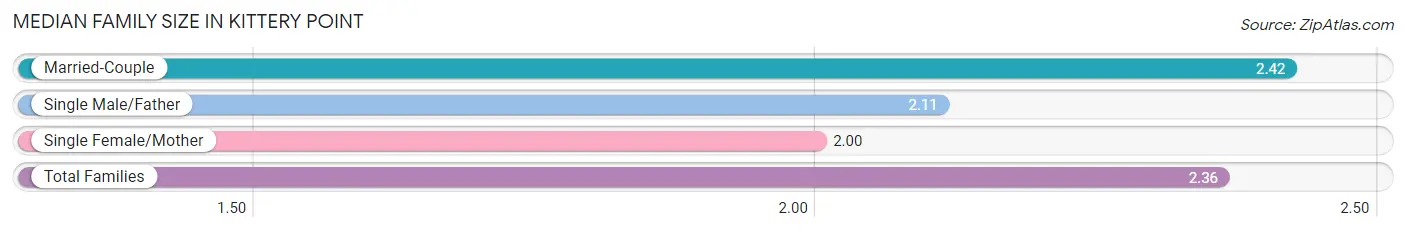
| Family Type | # Families | Family Size |
| Married-Couple | 281 (81.5%) | 2.42 |
| Single Male/Father | 47 (13.6%) | 2.11 |
| Single Female/Mother | 17 (4.9%) | 2.00 |
| Total Families | 345 (100.0%) | 2.36 |
Median Household Size in Kittery Point
The median household size in Kittery Point is 2.15 persons per household, with single female/mother households (17 | 3.6%) accounting for the largest median household size of 3.06 persons per household. non-family households (129 | 27.2%) represent the smallest median household size with 1.32 persons per household.
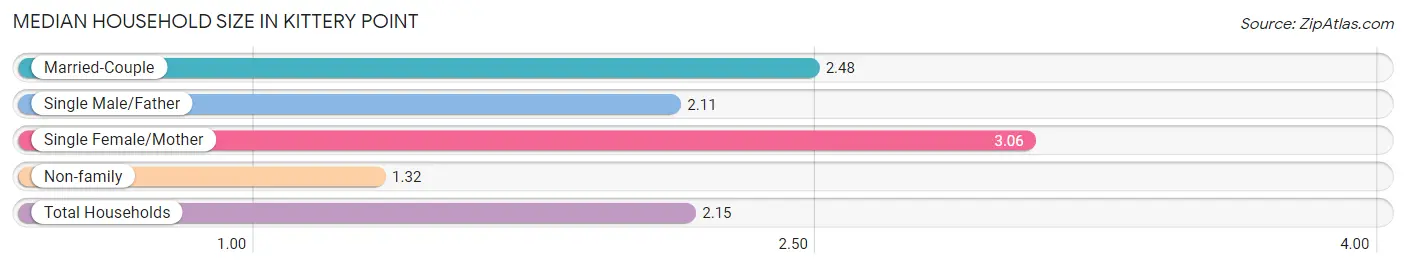
| Household Type | # Households | Household Size |
| Married-Couple | 281 (59.3%) | 2.48 |
| Single Male/Father | 47 (9.9%) | 2.11 |
| Single Female/Mother | 17 (3.6%) | 3.06 |
| Non-family | 129 (27.2%) | 1.32 |
| Total Households | 474 (100.0%) | 2.15 |
Household Size by Marriage Status in Kittery Point
Out of a total of 474 households in Kittery Point, 345 (72.8%) are family households, while 129 (27.2%) are nonfamily households. The most numerous type of family households are 3-person households, comprising 164, and the most common type of nonfamily households are 1-person households, comprising 86.
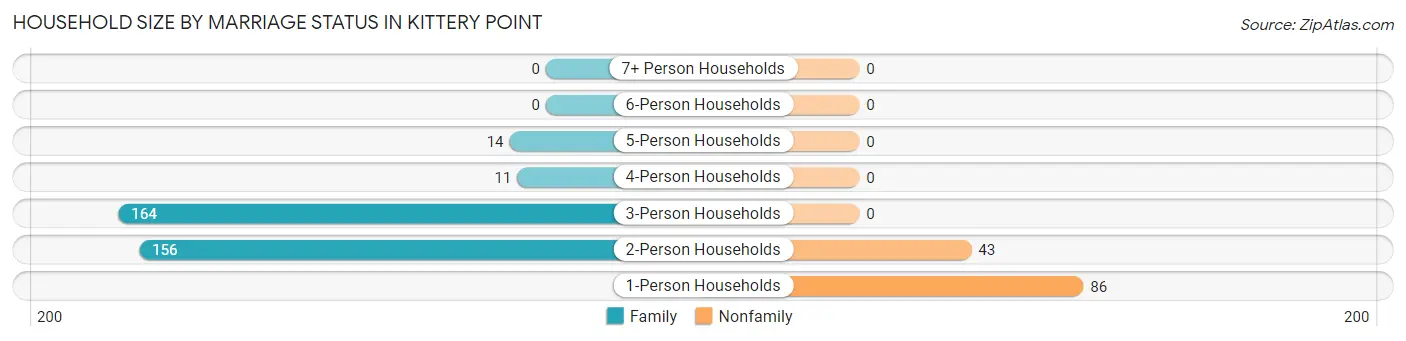
| Household Size | Family Households | Nonfamily Households |
| 1-Person Households | - | 86 (18.1%) |
| 2-Person Households | 156 (32.9%) | 43 (9.1%) |
| 3-Person Households | 164 (34.6%) | 0 (0.0%) |
| 4-Person Households | 11 (2.3%) | 0 (0.0%) |
| 5-Person Households | 14 (2.9%) | 0 (0.0%) |
| 6-Person Households | 0 (0.0%) | 0 (0.0%) |
| 7+ Person Households | 0 (0.0%) | 0 (0.0%) |
| Total | 345 (72.8%) | 129 (27.2%) |
Female Fertility in Kittery Point
Fertility by Age in Kittery Point
Average fertility rate in Kittery Point is 22.0 births per 1,000 women. Women in the age bracket of 35 to 50 years have the highest fertility rate with 31.0 births per 1,000 women. Women in the age bracket of 35 to 50 years acount for 100.0% of all women with births.
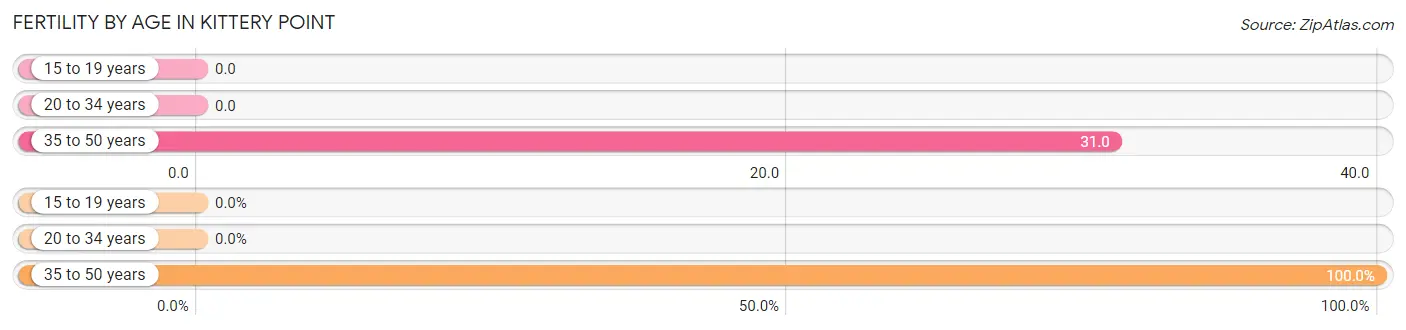
| Age Bracket | Women with Births | Births / 1,000 Women |
| 15 to 19 years | 0 (0.0%) | 0.0 |
| 20 to 34 years | 0 (0.0%) | 0.0 |
| 35 to 50 years | 6 (100.0%) | 31.0 |
| Total | 6 (100.0%) | 22.0 |
Fertility by Age by Marriage Status in Kittery Point
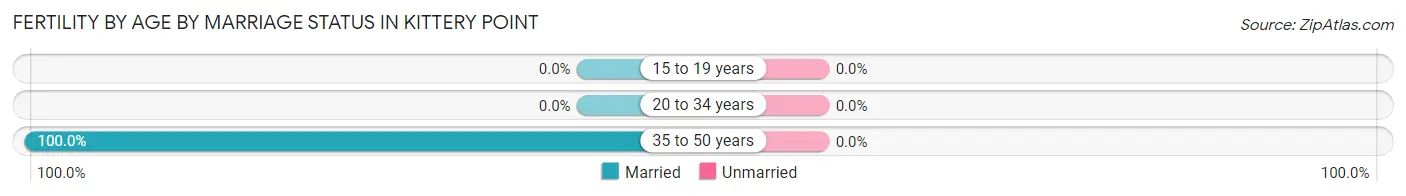
| Age Bracket | Married | Unmarried |
| 15 to 19 years | 0 (0.0%) | 0 (0.0%) |
| 20 to 34 years | 0 (0.0%) | 0 (0.0%) |
| 35 to 50 years | 6 (100.0%) | 0 (0.0%) |
| Total | 6 (100.0%) | 0 (0.0%) |
Fertility by Education in Kittery Point
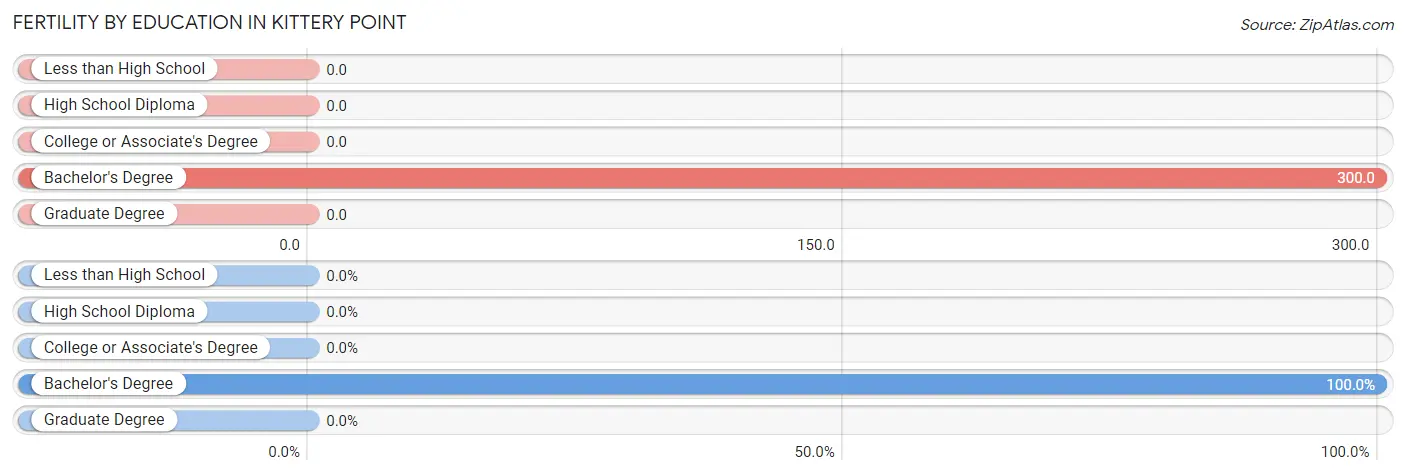
| Educational Attainment | Women with Births | Births / 1,000 Women |
| Less than High School | 0 (0.0%) | 0.0 |
| High School Diploma | 0 (0.0%) | 0.0 |
| College or Associate's Degree | 0 (0.0%) | 0.0 |
| Bachelor's Degree | 6 (100.0%) | 300.0 |
| Graduate Degree | 0 (0.0%) | 0.0 |
| Total | 6 (100.0%) | 22.0 |
Fertility by Education by Marriage Status in Kittery Point
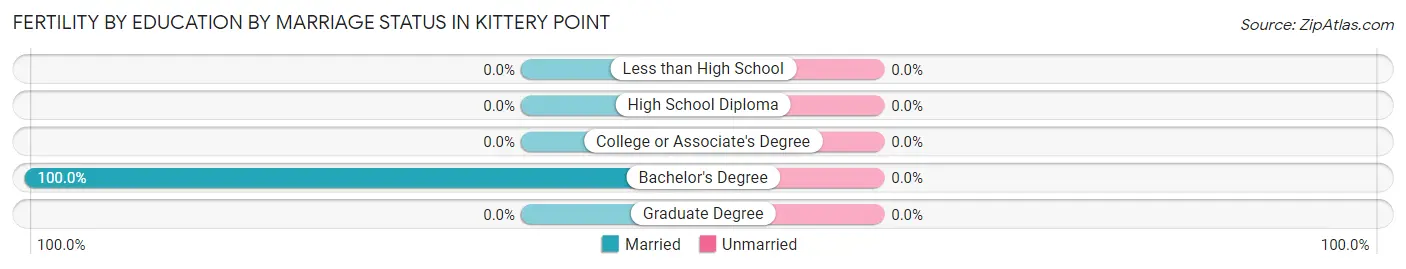
| Educational Attainment | Married | Unmarried |
| Less than High School | 0 (0.0%) | 0 (0.0%) |
| High School Diploma | 0 (0.0%) | 0 (0.0%) |
| College or Associate's Degree | 0 (0.0%) | 0 (0.0%) |
| Bachelor's Degree | 6 (100.0%) | 0 (0.0%) |
| Graduate Degree | 0 (0.0%) | 0 (0.0%) |
| Total | 6 (100.0%) | 0 (0.0%) |
Income in Kittery Point
Income Overview in Kittery Point
Per Capita Income in Kittery Point is $50,833, while median incomes of families and households are $130,818 and $121,042 respectively.
| Characteristic | Number | Measure |
| Per Capita Income | 1,017 | $50,833 |
| Median Family Income | 345 | $130,818 |
| Mean Family Income | 345 | $122,414 |
| Median Household Income | 474 | $121,042 |
| Mean Household Income | 474 | $111,853 |
| Income Deficit | 345 | $0 |
| Wage / Income Gap (%) | 1,017 | 37.37% |
| Wage / Income Gap ($) | 1,017 | 62.63¢ per $1 |
| Gini / Inequality Index | 1,017 | 0.28 |
Earnings by Sex in Kittery Point
Average Earnings in Kittery Point are $42,837, $66,583 for men and $41,701 for women, a difference of 37.4%.
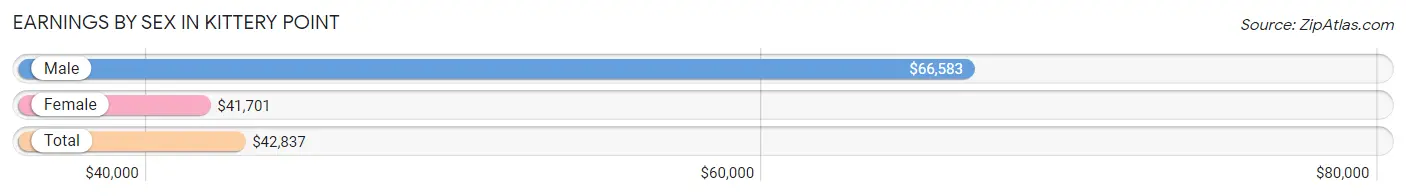
| Sex | Number | Average Earnings |
| Male | 343 (51.8%) | $66,583 |
| Female | 319 (48.2%) | $41,701 |
| Total | 662 (100.0%) | $42,837 |
Earnings by Sex by Income Bracket in Kittery Point
The most common earnings brackets in Kittery Point are $75,000 to $99,999 for men (123 | 35.9%) and $40,000 to $44,999 for women (185 | 58.0%).
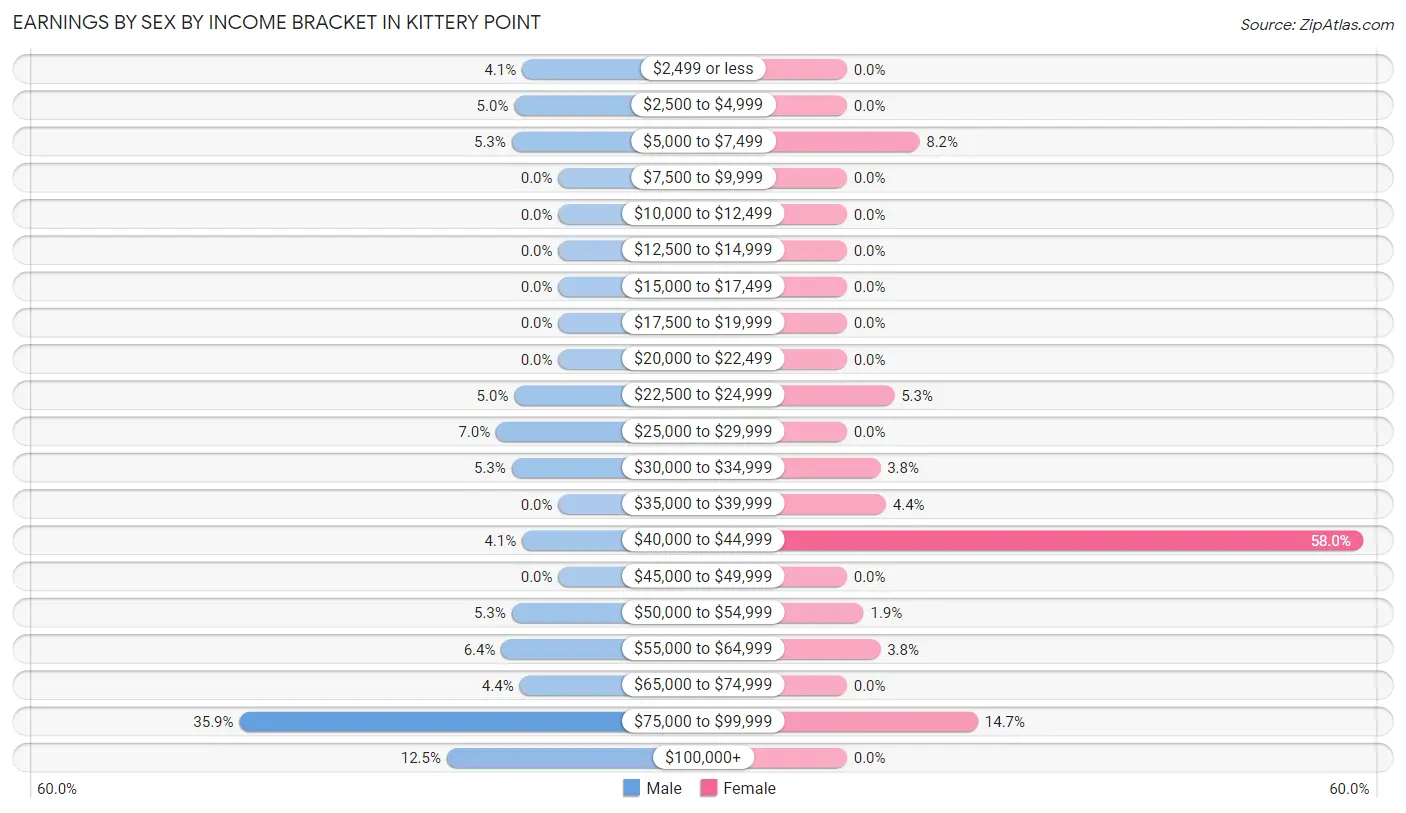
| Income | Male | Female |
| $2,499 or less | 14 (4.1%) | 0 (0.0%) |
| $2,500 to $4,999 | 17 (5.0%) | 0 (0.0%) |
| $5,000 to $7,499 | 18 (5.2%) | 26 (8.2%) |
| $7,500 to $9,999 | 0 (0.0%) | 0 (0.0%) |
| $10,000 to $12,499 | 0 (0.0%) | 0 (0.0%) |
| $12,500 to $14,999 | 0 (0.0%) | 0 (0.0%) |
| $15,000 to $17,499 | 0 (0.0%) | 0 (0.0%) |
| $17,500 to $19,999 | 0 (0.0%) | 0 (0.0%) |
| $20,000 to $22,499 | 0 (0.0%) | 0 (0.0%) |
| $22,500 to $24,999 | 17 (5.0%) | 17 (5.3%) |
| $25,000 to $29,999 | 24 (7.0%) | 0 (0.0%) |
| $30,000 to $34,999 | 18 (5.2%) | 12 (3.8%) |
| $35,000 to $39,999 | 0 (0.0%) | 14 (4.4%) |
| $40,000 to $44,999 | 14 (4.1%) | 185 (58.0%) |
| $45,000 to $49,999 | 0 (0.0%) | 0 (0.0%) |
| $50,000 to $54,999 | 18 (5.2%) | 6 (1.9%) |
| $55,000 to $64,999 | 22 (6.4%) | 12 (3.8%) |
| $65,000 to $74,999 | 15 (4.4%) | 0 (0.0%) |
| $75,000 to $99,999 | 123 (35.9%) | 47 (14.7%) |
| $100,000+ | 43 (12.5%) | 0 (0.0%) |
| Total | 343 (100.0%) | 319 (100.0%) |
Earnings by Sex by Educational Attainment in Kittery Point
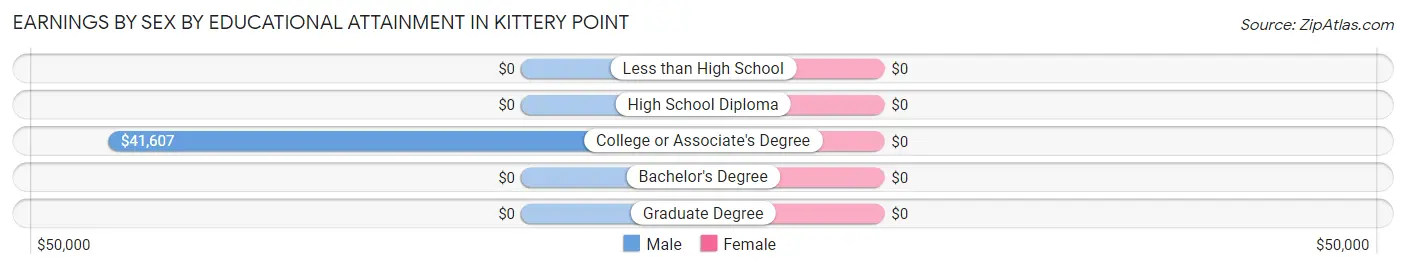
| Educational Attainment | Male Income | Female Income |
| Less than High School | - | - |
| High School Diploma | - | - |
| College or Associate's Degree | $41,607 | $0 |
| Bachelor's Degree | - | - |
| Graduate Degree | - | - |
| Total | $90,047 | $41,363 |
Family Income in Kittery Point
Family Income Brackets in Kittery Point
According to the Kittery Point family income data, there are 183 families falling into the $100,000 to $149,999 income range, which is the most common income bracket and makes up 53.0% of all families.
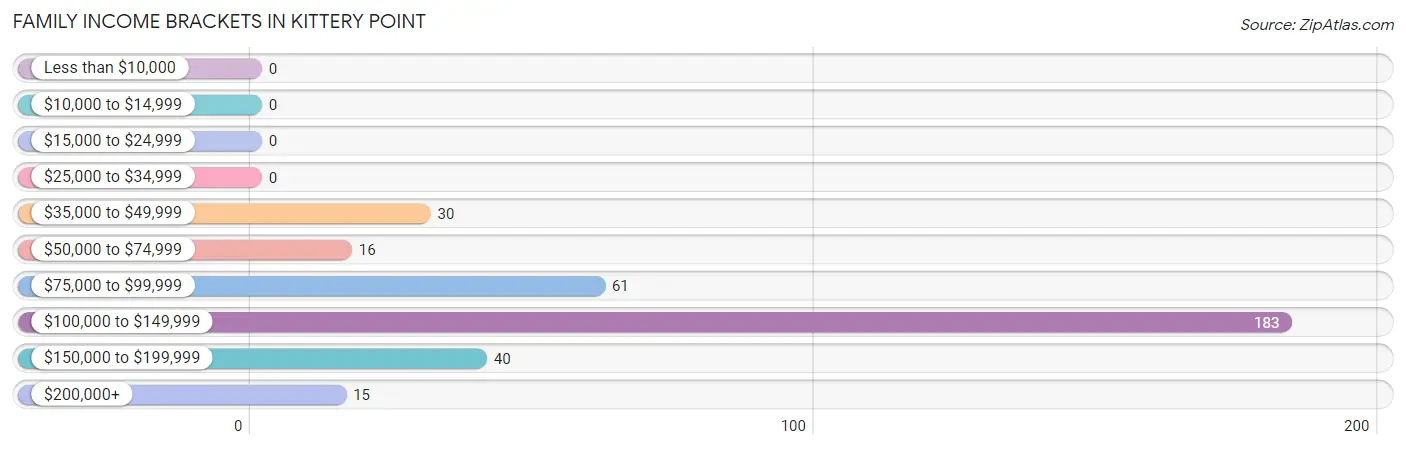
| Income Bracket | # Families | % Families |
| Less than $10,000 | 0 | 0.0% |
| $10,000 to $14,999 | 0 | 0.0% |
| $15,000 to $24,999 | 0 | 0.0% |
| $25,000 to $34,999 | 0 | 0.0% |
| $35,000 to $49,999 | 30 | 8.7% |
| $50,000 to $74,999 | 16 | 4.6% |
| $75,000 to $99,999 | 61 | 17.7% |
| $100,000 to $149,999 | 183 | 53.0% |
| $150,000 to $199,999 | 40 | 11.6% |
| $200,000+ | 15 | 4.3% |
Family Income by Famaliy Size in Kittery Point
2-person families (173 | 50.1%) account for the highest median family income in Kittery Point with $84,654 per family, while 2-person families (173 | 50.1%) have the highest median income of $42,327 per family member.
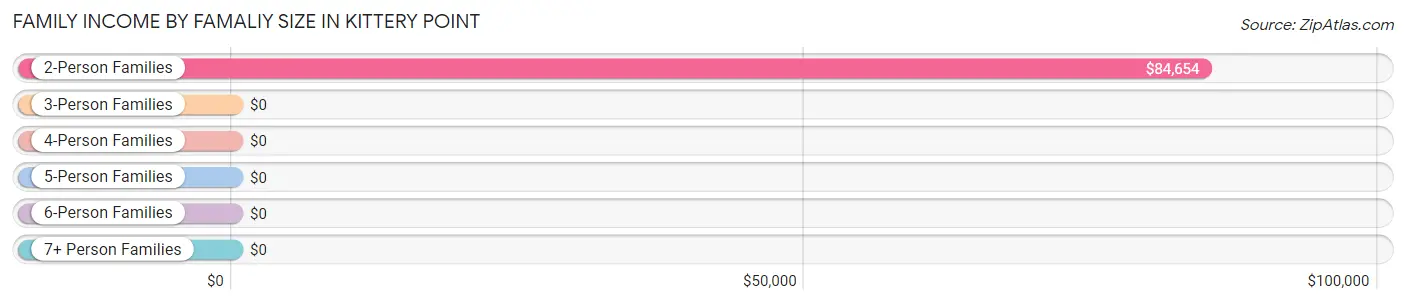
| Income Bracket | # Families | Median Income |
| 2-Person Families | 173 (50.1%) | $84,654 |
| 3-Person Families | 147 (42.6%) | $0 |
| 4-Person Families | 25 (7.2%) | $0 |
| 5-Person Families | 0 (0.0%) | $0 |
| 6-Person Families | 0 (0.0%) | $0 |
| 7+ Person Families | 0 (0.0%) | $0 |
| Total | 345 (100.0%) | $130,818 |
Family Income by Number of Earners in Kittery Point
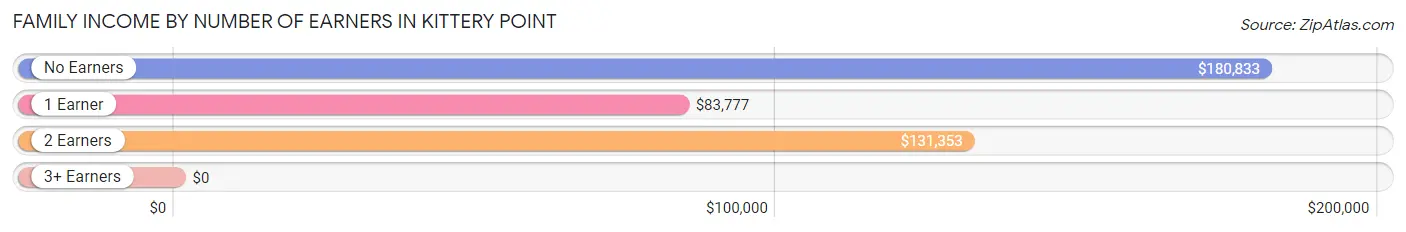
| Number of Earners | # Families | Median Income |
| No Earners | 46 (13.3%) | $180,833 |
| 1 Earner | 96 (27.8%) | $83,777 |
| 2 Earners | 178 (51.6%) | $131,353 |
| 3+ Earners | 25 (7.2%) | $0 |
| Total | 345 (100.0%) | $130,818 |
Household Income in Kittery Point
Household Income Brackets in Kittery Point
With 195 households falling in the category, the $100,000 to $149,999 income range is the most frequent in Kittery Point, accounting for 41.1% of all households.
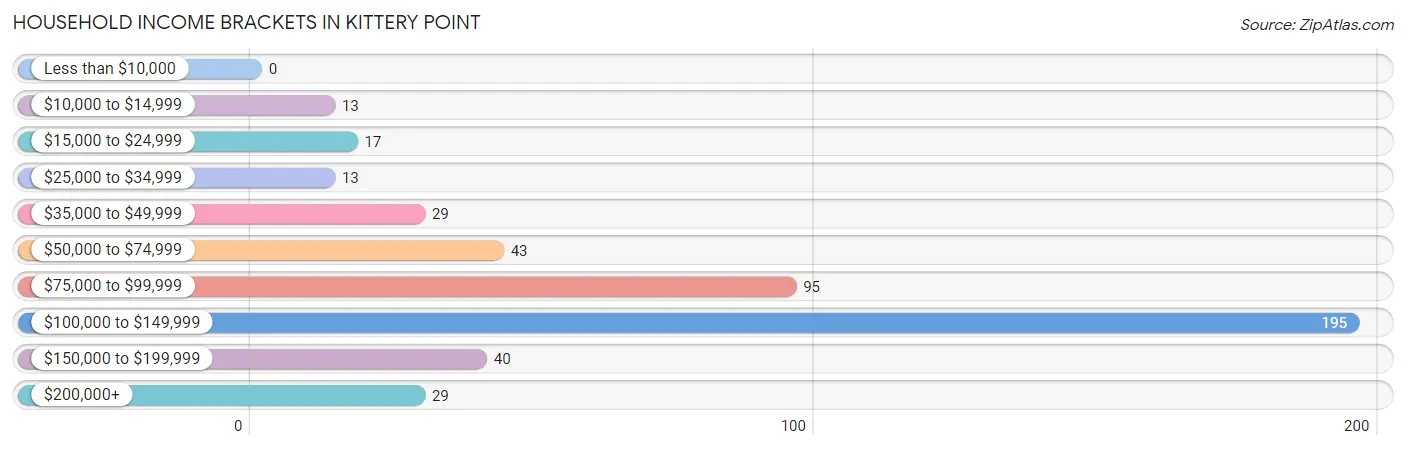
| Income Bracket | # Households | % Households |
| Less than $10,000 | 0 | 0.0% |
| $10,000 to $14,999 | 13 | 2.7% |
| $15,000 to $24,999 | 17 | 3.6% |
| $25,000 to $34,999 | 13 | 2.7% |
| $35,000 to $49,999 | 29 | 6.1% |
| $50,000 to $74,999 | 43 | 9.1% |
| $75,000 to $99,999 | 95 | 20.0% |
| $100,000 to $149,999 | 195 | 41.1% |
| $150,000 to $199,999 | 40 | 8.4% |
| $200,000+ | 29 | 6.1% |
Household Income by Householder Age in Kittery Point
The median household income in Kittery Point is $121,042, with the highest median household income of $130,949 found in the 45 to 64 years age bracket for the primary householder. A total of 249 households (52.5%) fall into this category.
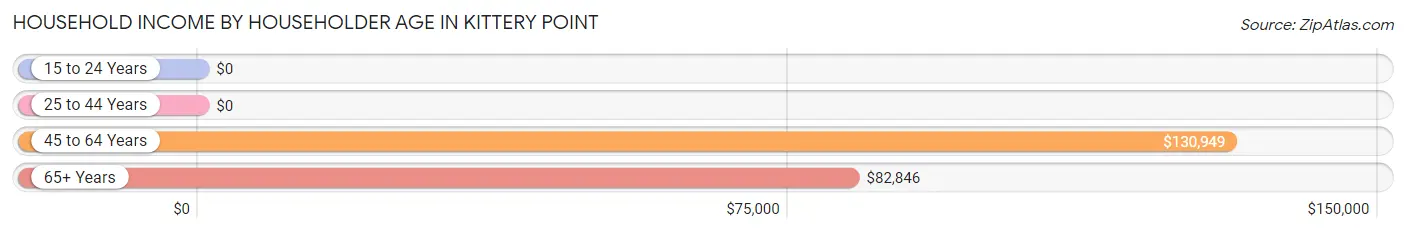
| Income Bracket | # Households | Median Income |
| 15 to 24 Years | 0 (0.0%) | $0 |
| 25 to 44 Years | 12 (2.5%) | $0 |
| 45 to 64 Years | 249 (52.5%) | $130,949 |
| 65+ Years | 213 (44.9%) | $82,846 |
| Total | 474 (100.0%) | $121,042 |
Poverty in Kittery Point
Income Below Poverty by Sex and Age in Kittery Point
With 3.9% poverty level for males and 2.9% for females among the residents of Kittery Point, 55 to 64 year old males and 18 to 24 year old females are the most vulnerable to poverty, with 18 males (18.8%) and 16 females (23.5%) in their respective age groups living below the poverty level.
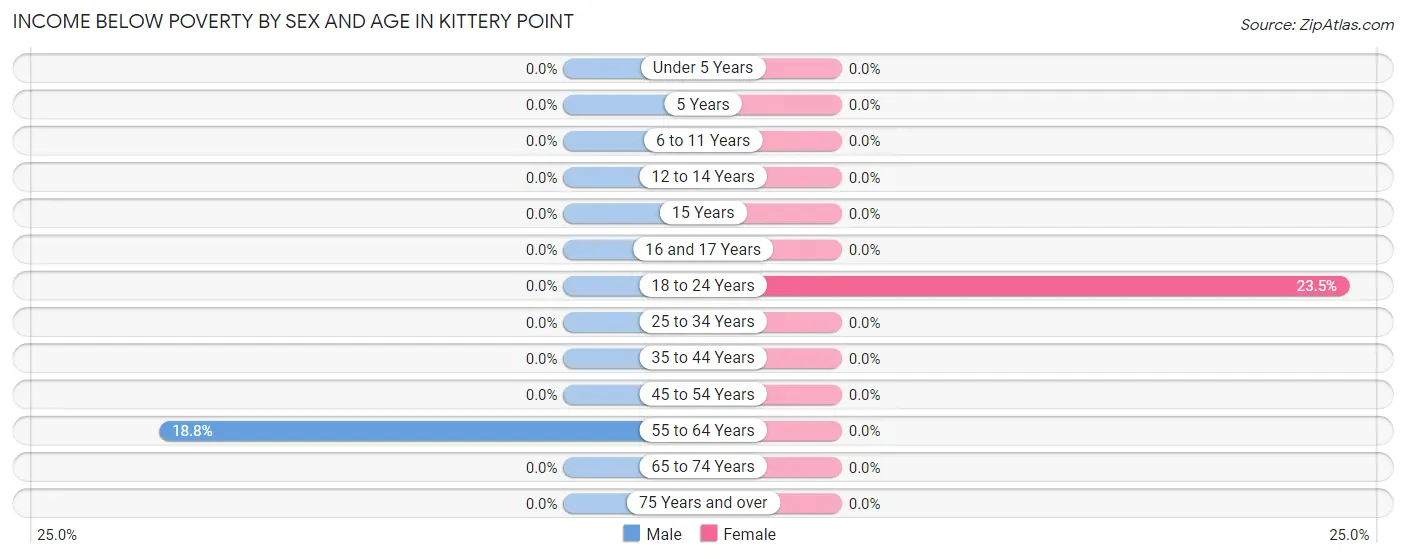
| Age Bracket | Male | Female |
| Under 5 Years | 0 (0.0%) | 0 (0.0%) |
| 5 Years | 0 (0.0%) | 0 (0.0%) |
| 6 to 11 Years | 0 (0.0%) | 0 (0.0%) |
| 12 to 14 Years | 0 (0.0%) | 0 (0.0%) |
| 15 Years | 0 (0.0%) | 0 (0.0%) |
| 16 and 17 Years | 0 (0.0%) | 0 (0.0%) |
| 18 to 24 Years | 0 (0.0%) | 16 (23.5%) |
| 25 to 34 Years | 0 (0.0%) | 0 (0.0%) |
| 35 to 44 Years | 0 (0.0%) | 0 (0.0%) |
| 45 to 54 Years | 0 (0.0%) | 0 (0.0%) |
| 55 to 64 Years | 18 (18.8%) | 0 (0.0%) |
| 65 to 74 Years | 0 (0.0%) | 0 (0.0%) |
| 75 Years and over | 0 (0.0%) | 0 (0.0%) |
| Total | 18 (3.9%) | 16 (2.9%) |
Income Above Poverty by Sex and Age in Kittery Point
According to the poverty statistics in Kittery Point, males aged 16 and 17 years and females aged 6 to 11 years are the age groups that are most secure financially, with 100.0% of males and 100.0% of females in these age groups living above the poverty line.
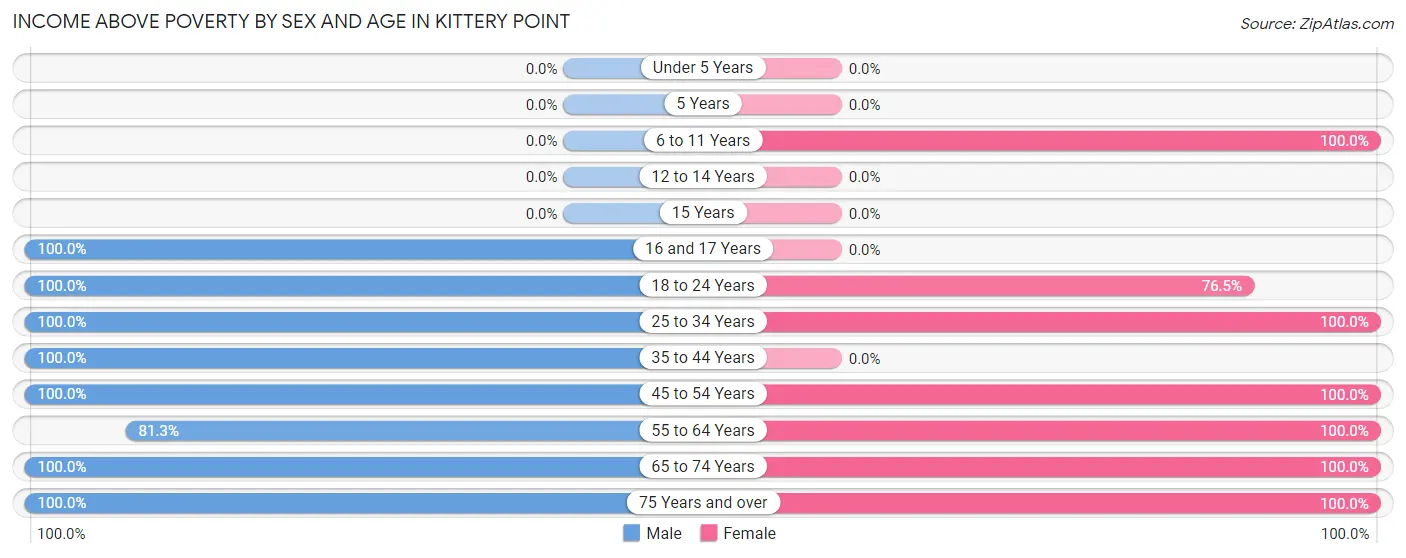
| Age Bracket | Male | Female |
| Under 5 Years | 0 (0.0%) | 0 (0.0%) |
| 5 Years | 0 (0.0%) | 0 (0.0%) |
| 6 to 11 Years | 0 (0.0%) | 67 (100.0%) |
| 12 to 14 Years | 0 (0.0%) | 0 (0.0%) |
| 15 Years | 0 (0.0%) | 0 (0.0%) |
| 16 and 17 Years | 28 (100.0%) | 0 (0.0%) |
| 18 to 24 Years | 35 (100.0%) | 52 (76.5%) |
| 25 to 34 Years | 25 (100.0%) | 12 (100.0%) |
| 35 to 44 Years | 14 (100.0%) | 0 (0.0%) |
| 45 to 54 Years | 132 (100.0%) | 196 (100.0%) |
| 55 to 64 Years | 78 (81.2%) | 66 (100.0%) |
| 65 to 74 Years | 99 (100.0%) | 86 (100.0%) |
| 75 Years and over | 33 (100.0%) | 60 (100.0%) |
| Total | 444 (96.1%) | 539 (97.1%) |
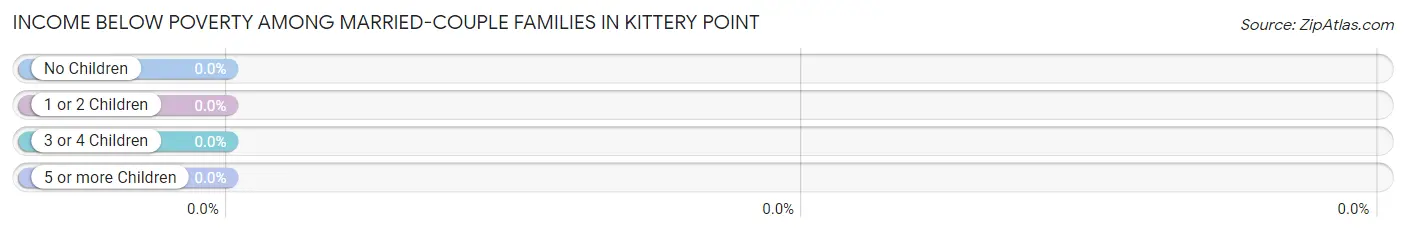
Income Below Poverty Among Married-Couple Families in Kittery Point
| Children | Above Poverty | Below Poverty |
| No Children | 123 (100.0%) | 0 (0.0%) |
| 1 or 2 Children | 158 (100.0%) | 0 (0.0%) |
| 3 or 4 Children | 0 (0.0%) | 0 (0.0%) |
| 5 or more Children | 0 (0.0%) | 0 (0.0%) |
| Total | 281 (100.0%) | 0 (0.0%) |
Income Below Poverty Among Single-Parent Households in Kittery Point
| Children | Single Father | Single Mother |
| No Children | 0 (0.0%) | 0 (0.0%) |
| 1 or 2 Children | 0 (0.0%) | 0 (0.0%) |
| 3 or 4 Children | 0 (0.0%) | 0 (0.0%) |
| 5 or more Children | 0 (0.0%) | 0 (0.0%) |
| Total | 0 (0.0%) | 0 (0.0%) |
Income Below Poverty Among Married-Couple vs Single-Parent Households in Kittery Point
| Children | Married-Couple Families | Single-Parent Households |
| No Children | 0 (0.0%) | 0 (0.0%) |
| 1 or 2 Children | 0 (0.0%) | 0 (0.0%) |
| 3 or 4 Children | 0 (0.0%) | 0 (0.0%) |
| 5 or more Children | 0 (0.0%) | 0 (0.0%) |
| Total | 0 (0.0%) | 0 (0.0%) |
Employment Characteristics in Kittery Point
Employment by Class of Employer in Kittery Point
Among the 590 employed individuals in Kittery Point, private company employees (243 | 41.2%), self-employed (not incorporated) (180 | 30.5%), and not-for-profit organizations (106 | 18.0%) make up the most common classes of employment.
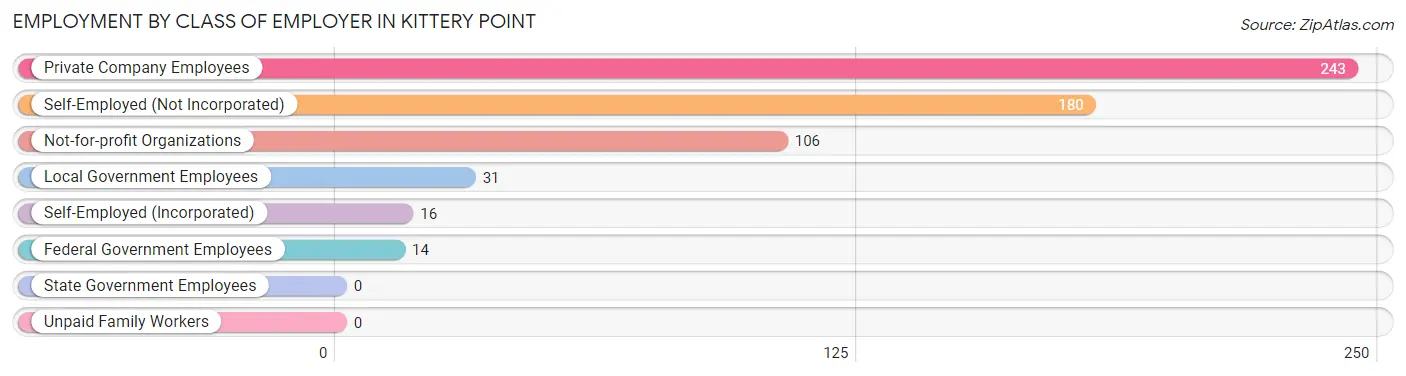
| Employer Class | # Employees | % Employees |
| Private Company Employees | 243 | 41.2% |
| Self-Employed (Incorporated) | 16 | 2.7% |
| Self-Employed (Not Incorporated) | 180 | 30.5% |
| Not-for-profit Organizations | 106 | 18.0% |
| Local Government Employees | 31 | 5.2% |
| State Government Employees | 0 | 0.0% |
| Federal Government Employees | 14 | 2.4% |
| Unpaid Family Workers | 0 | 0.0% |
| Total | 590 | 100.0% |
Employment Status by Age in Kittery Point
According to the labor force statistics for Kittery Point, out of the total population over 16 years of age (950), 66.5% or 632 individuals are in the labor force, with 0.9% or 6 of them unemployed. The age group with the highest labor force participation rate is 20 to 24 years, with 100.0% or 86 individuals in the labor force. Within the labor force, the 45 to 54 years age range has the highest percentage of unemployed individuals, with 1.8% or 6 of them being unemployed.
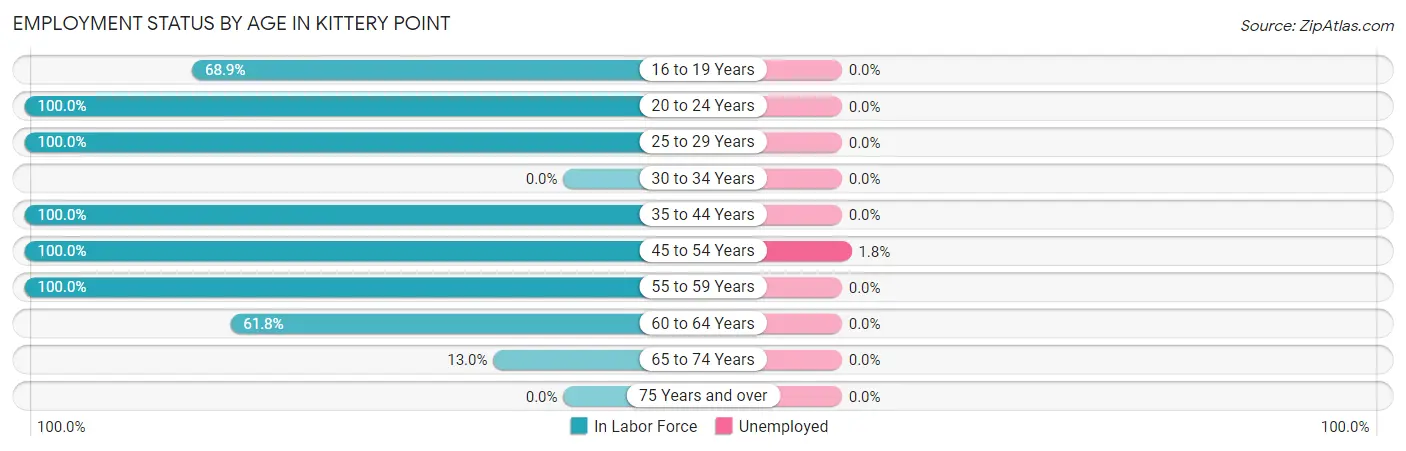
| Age Bracket | In Labor Force | Unemployed |
| 16 to 19 Years | 31 (68.9%) | 0 (0.0%) |
| 20 to 24 Years | 86 (100.0%) | 0 (0.0%) |
| 25 to 29 Years | 37 (100.0%) | 0 (0.0%) |
| 30 to 34 Years | 0 (0.0%) | 0 (0.0%) |
| 35 to 44 Years | 14 (100.0%) | 0 (0.0%) |
| 45 to 54 Years | 328 (100.0%) | 6 (1.8%) |
| 55 to 59 Years | 31 (100.0%) | 0 (0.0%) |
| 60 to 64 Years | 81 (61.8%) | 0 (0.0%) |
| 65 to 74 Years | 24 (13.0%) | 0 (0.0%) |
| 75 Years and over | 0 (0.0%) | 0 (0.0%) |
| Total | 632 (66.5%) | 6 (0.9%) |
Employment Status by Educational Attainment in Kittery Point
According to labor force statistics for Kittery Point, 90.8% of individuals (491) out of the total population between 25 and 64 years of age (541) are in the labor force, with 1.2% or 6 of them being unemployed. The group with the highest labor force participation rate are those with the educational attainment of less than high school, with 100.0% or 18 individuals in the labor force. Within the labor force, individuals with bachelor's degree or higher education have the highest percentage of unemployment, with 2.0% or 6 of them being unemployed.
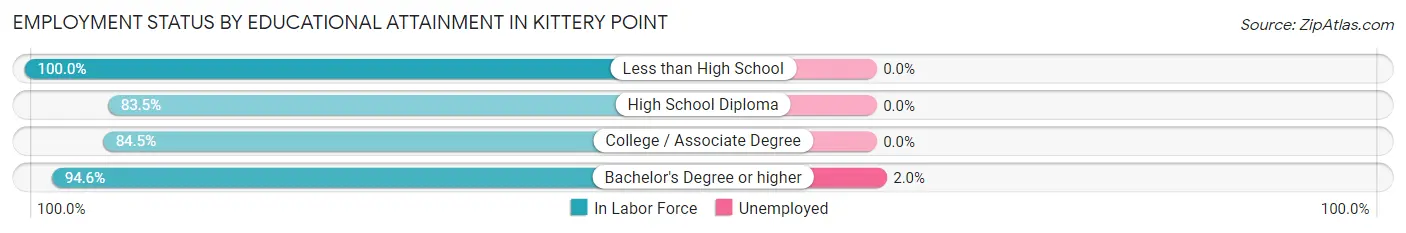
| Educational Attainment | In Labor Force | Unemployed |
| Less than High School | 18 (100.0%) | 0 (0.0%) |
| High School Diploma | 86 (83.5%) | 0 (0.0%) |
| College / Associate Degree | 87 (84.5%) | 0 (0.0%) |
| Bachelor's Degree or higher | 300 (94.6%) | 6 (2.0%) |
| Total | 491 (90.8%) | 6 (1.2%) |
Employment Occupations by Sex in Kittery Point
Management, Business, Science and Arts Occupations
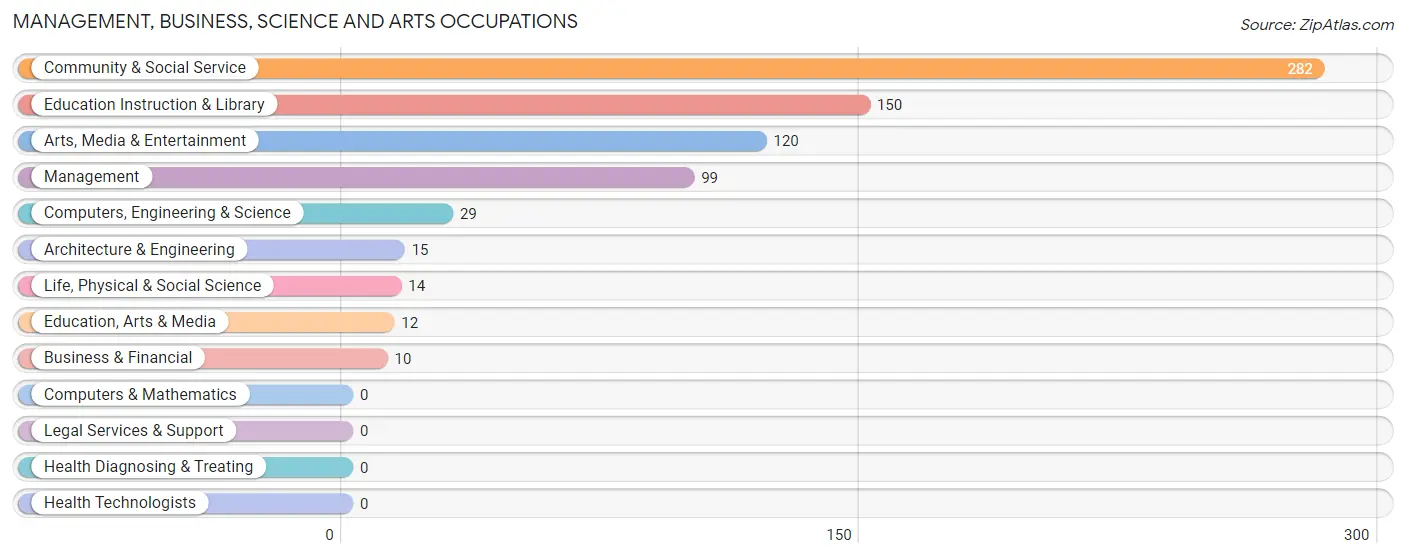
The most common Management, Business, Science and Arts occupations in Kittery Point are Community & Social Service (282 | 45.1%), Education Instruction & Library (150 | 24.0%), Arts, Media & Entertainment (120 | 19.2%), Management (99 | 15.8%), and Computers, Engineering & Science (29 | 4.6%).
Management, Business, Science and Arts Occupations by Sex
Within the Management, Business, Science and Arts occupations in Kittery Point, the most male-oriented occupations are Computers, Engineering & Science (100.0%), Architecture & Engineering (100.0%), and Life, Physical & Social Science (100.0%), while the most female-oriented occupations are Business & Financial (100.0%), Education, Arts & Media (100.0%), and Education Instruction & Library (100.0%).
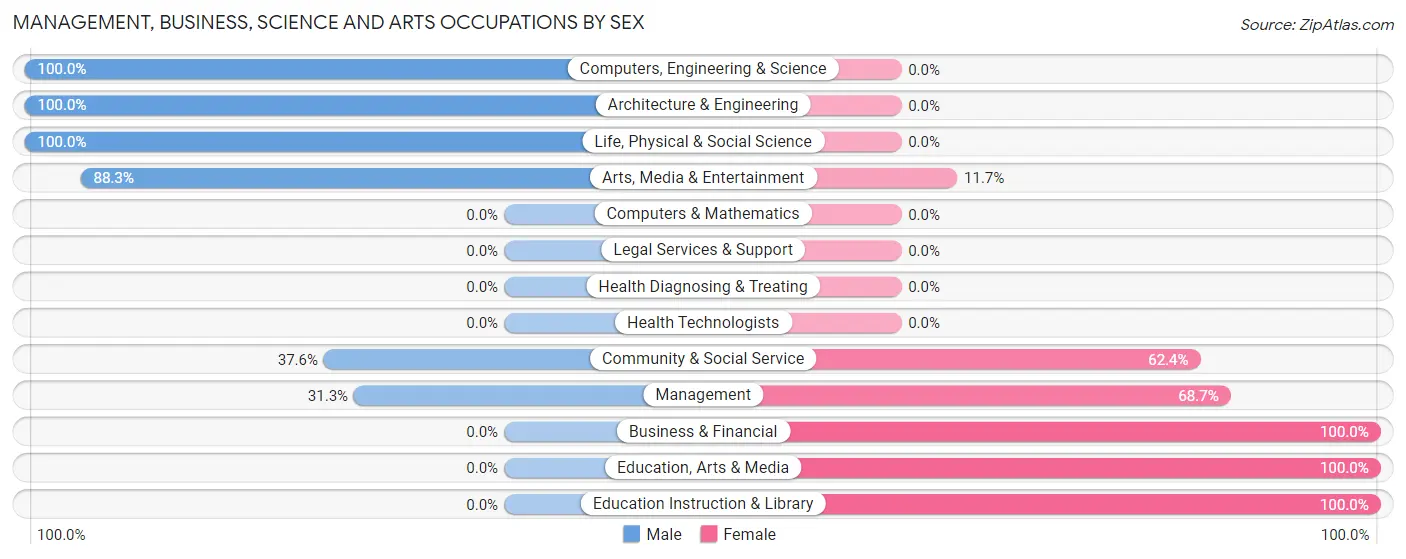
| Occupation | Male | Female |
| Management | 31 (31.3%) | 68 (68.7%) |
| Business & Financial | 0 (0.0%) | 10 (100.0%) |
| Computers, Engineering & Science | 29 (100.0%) | 0 (0.0%) |
| Computers & Mathematics | 0 (0.0%) | 0 (0.0%) |
| Architecture & Engineering | 15 (100.0%) | 0 (0.0%) |
| Life, Physical & Social Science | 14 (100.0%) | 0 (0.0%) |
| Community & Social Service | 106 (37.6%) | 176 (62.4%) |
| Education, Arts & Media | 0 (0.0%) | 12 (100.0%) |
| Legal Services & Support | 0 (0.0%) | 0 (0.0%) |
| Education Instruction & Library | 0 (0.0%) | 150 (100.0%) |
| Arts, Media & Entertainment | 106 (88.3%) | 14 (11.7%) |
| Health Diagnosing & Treating | 0 (0.0%) | 0 (0.0%) |
| Health Technologists | 0 (0.0%) | 0 (0.0%) |
| Total (Category) | 166 (39.5%) | 254 (60.5%) |
| Total (Overall) | 330 (52.7%) | 296 (47.3%) |
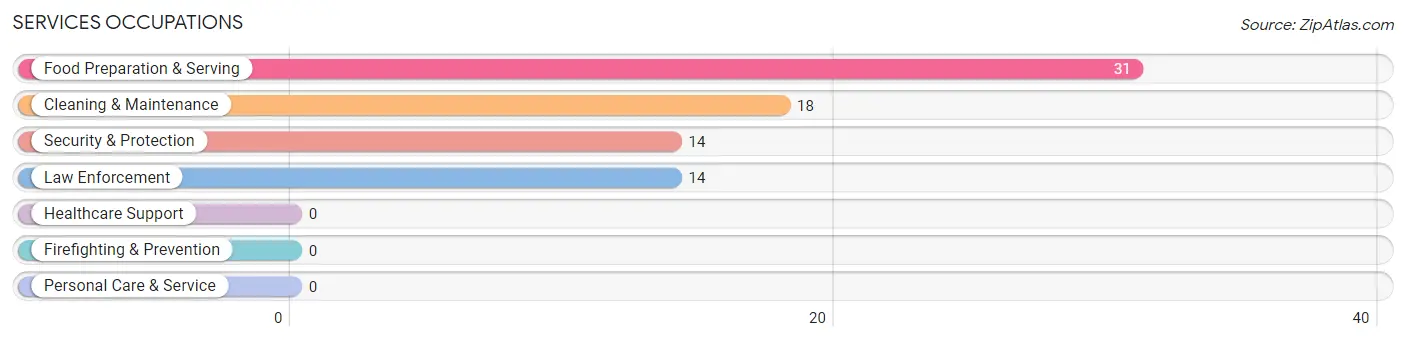
Services Occupations
The most common Services occupations in Kittery Point are Food Preparation & Serving (31 | 5.0%), Cleaning & Maintenance (18 | 2.9%), Security & Protection (14 | 2.2%), and Law Enforcement (14 | 2.2%).
Services Occupations by Sex
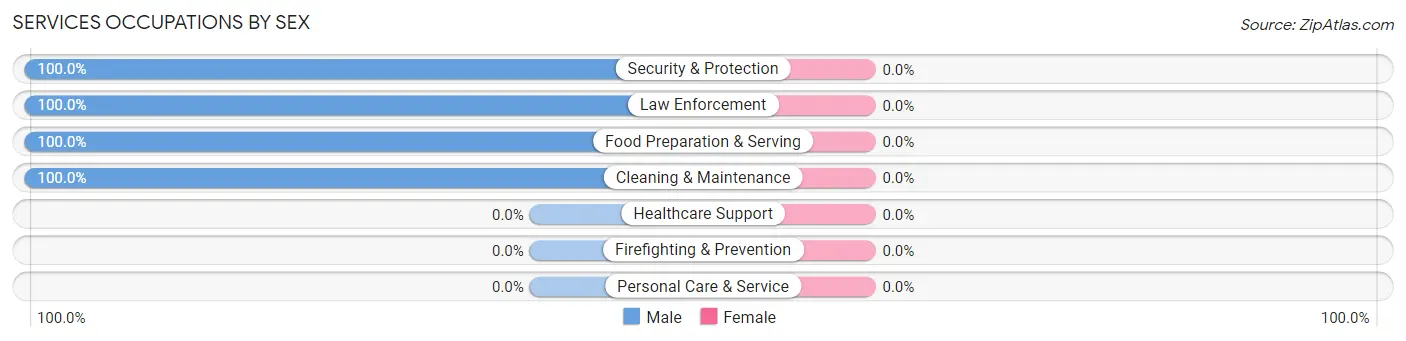
| Occupation | Male | Female |
| Healthcare Support | 0 (0.0%) | 0 (0.0%) |
| Security & Protection | 14 (100.0%) | 0 (0.0%) |
| Firefighting & Prevention | 0 (0.0%) | 0 (0.0%) |
| Law Enforcement | 14 (100.0%) | 0 (0.0%) |
| Food Preparation & Serving | 31 (100.0%) | 0 (0.0%) |
| Cleaning & Maintenance | 18 (100.0%) | 0 (0.0%) |
| Personal Care & Service | 0 (0.0%) | 0 (0.0%) |
| Total (Category) | 63 (100.0%) | 0 (0.0%) |
| Total (Overall) | 330 (52.7%) | 296 (47.3%) |
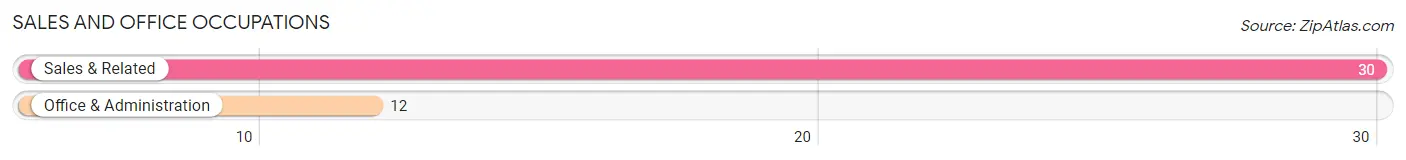
Sales and Office Occupations
The most common Sales and Office occupations in Kittery Point are Sales & Related (30 | 4.8%), and Office & Administration (12 | 1.9%).
Sales and Office Occupations by Sex
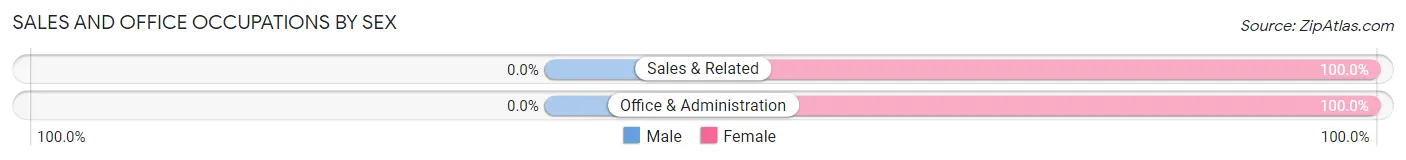
| Occupation | Male | Female |
| Sales & Related | 0 (0.0%) | 30 (100.0%) |
| Office & Administration | 0 (0.0%) | 12 (100.0%) |
| Total (Category) | 0 (0.0%) | 42 (100.0%) |
| Total (Overall) | 330 (52.7%) | 296 (47.3%) |
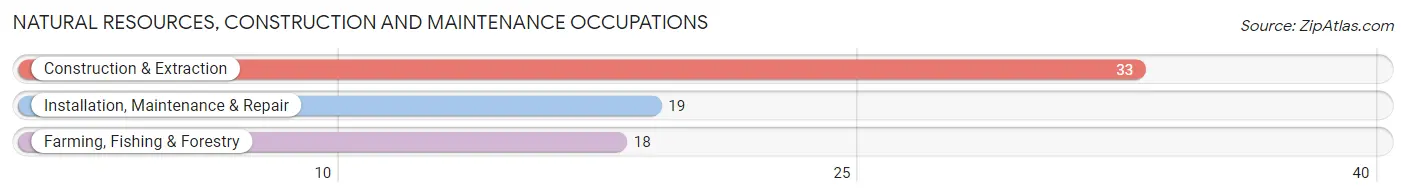
Natural Resources, Construction and Maintenance Occupations
The most common Natural Resources, Construction and Maintenance occupations in Kittery Point are Construction & Extraction (33 | 5.3%), Installation, Maintenance & Repair (19 | 3.0%), and Farming, Fishing & Forestry (18 | 2.9%).
Natural Resources, Construction and Maintenance Occupations by Sex
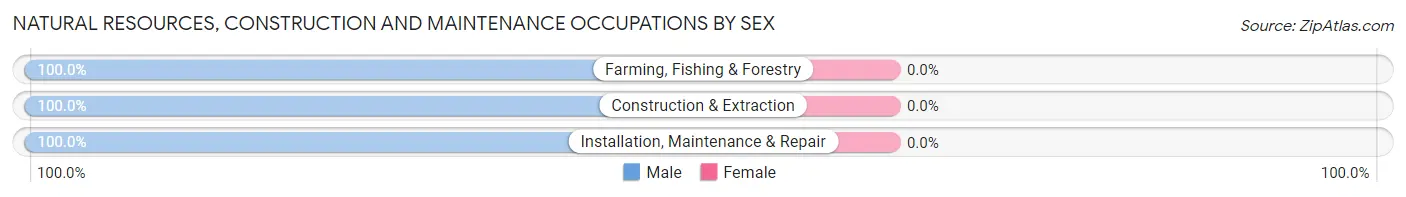
| Occupation | Male | Female |
| Farming, Fishing & Forestry | 18 (100.0%) | 0 (0.0%) |
| Construction & Extraction | 33 (100.0%) | 0 (0.0%) |
| Installation, Maintenance & Repair | 19 (100.0%) | 0 (0.0%) |
| Total (Category) | 70 (100.0%) | 0 (0.0%) |
| Total (Overall) | 330 (52.7%) | 296 (47.3%) |
Production, Transportation and Moving Occupations
The most common Production, Transportation and Moving occupations in Kittery Point are Production (17 | 2.7%), and Transportation (14 | 2.2%).
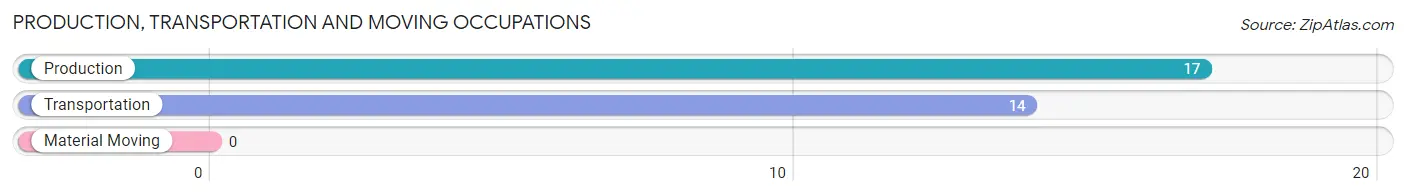
Production, Transportation and Moving Occupations by Sex
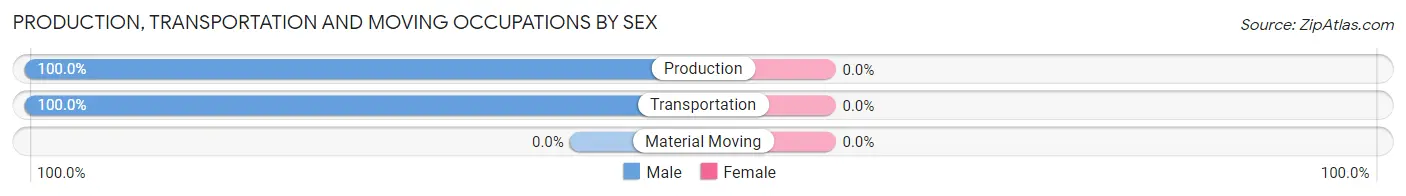
| Occupation | Male | Female |
| Production | 17 (100.0%) | 0 (0.0%) |
| Transportation | 14 (100.0%) | 0 (0.0%) |
| Material Moving | 0 (0.0%) | 0 (0.0%) |
| Total (Category) | 31 (100.0%) | 0 (0.0%) |
| Total (Overall) | 330 (52.7%) | 296 (47.3%) |
Employment Industries by Sex in Kittery Point
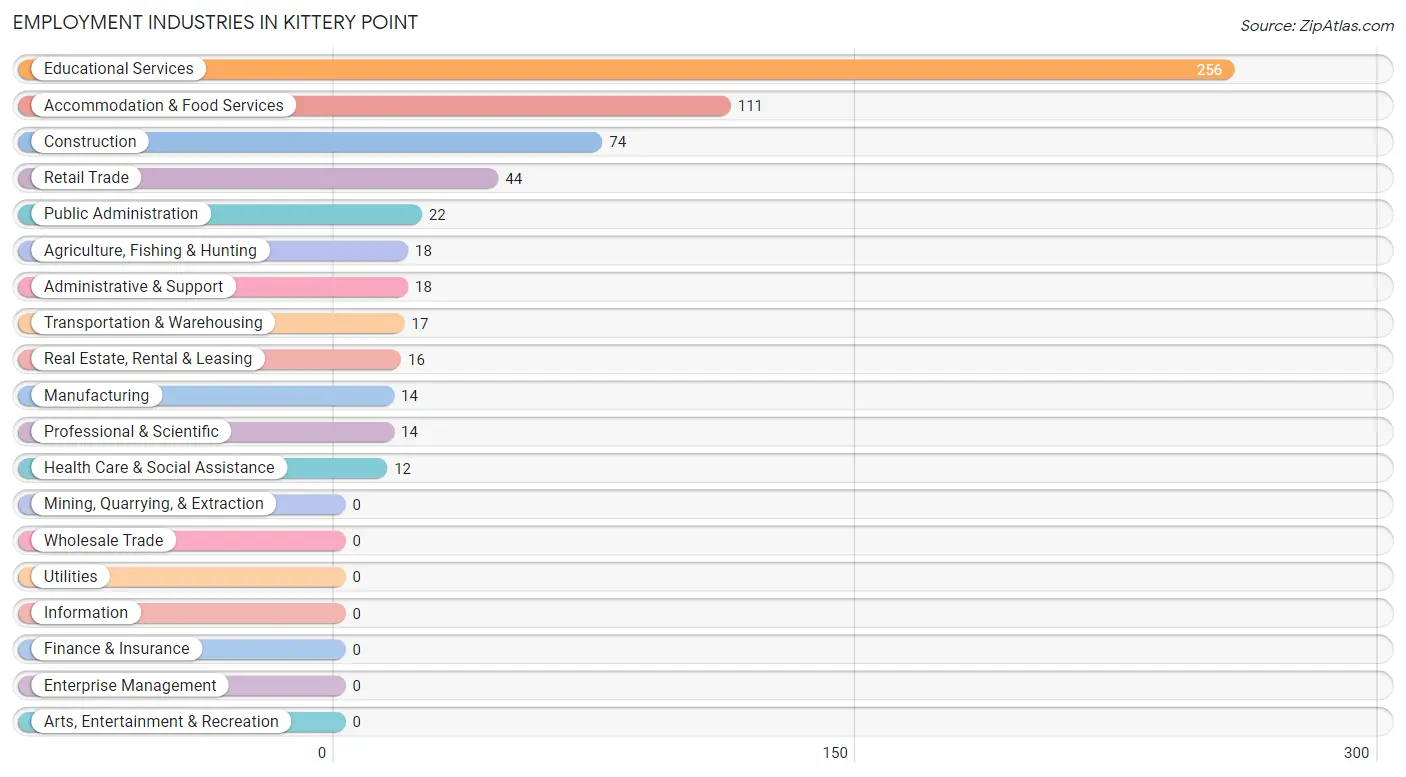
Employment Industries in Kittery Point
The major employment industries in Kittery Point include Educational Services (256 | 40.9%), Accommodation & Food Services (111 | 17.7%), Construction (74 | 11.8%), Retail Trade (44 | 7.0%), and Public Administration (22 | 3.5%).
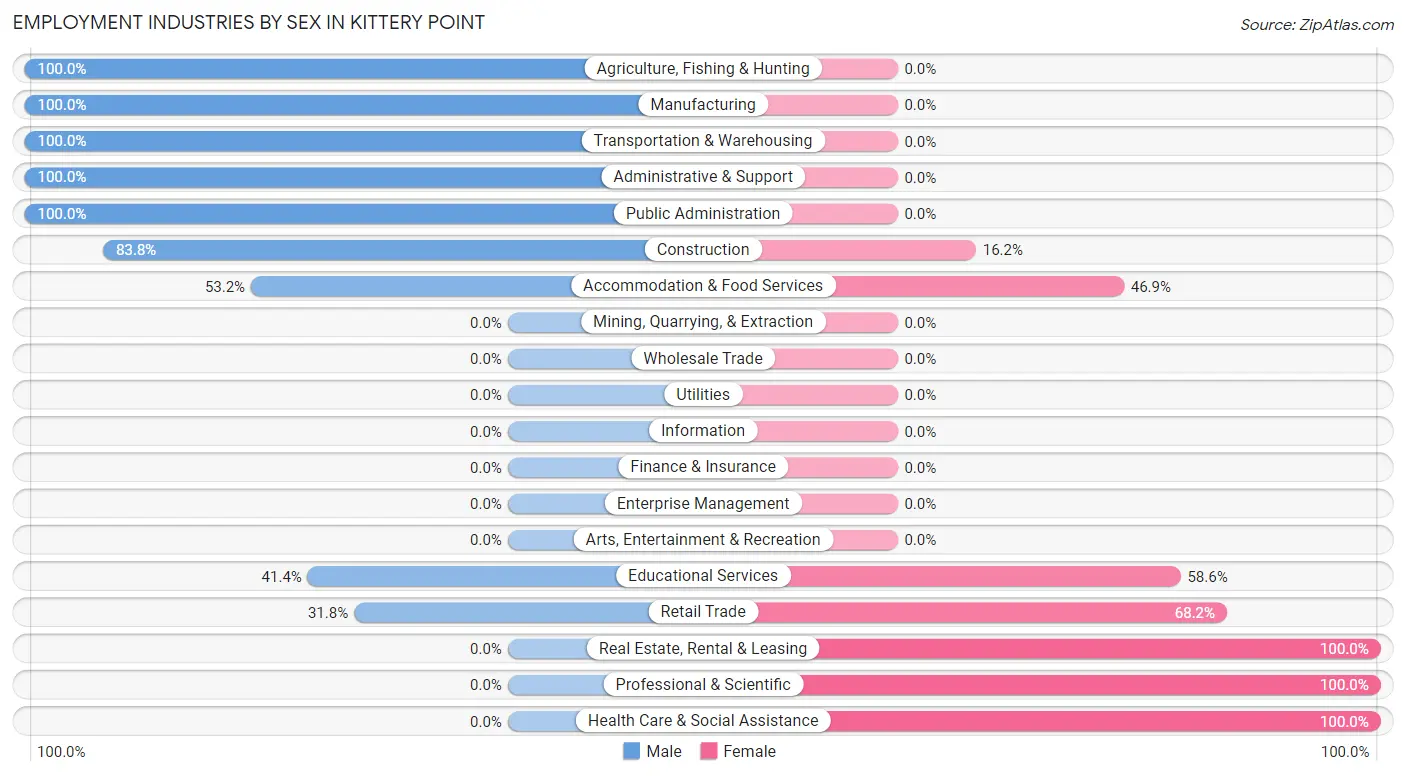
Employment Industries by Sex in Kittery Point
The Kittery Point industries that see more men than women are Agriculture, Fishing & Hunting (100.0%), Manufacturing (100.0%), and Transportation & Warehousing (100.0%), whereas the industries that tend to have a higher number of women are Real Estate, Rental & Leasing (100.0%), Professional & Scientific (100.0%), and Health Care & Social Assistance (100.0%).
| Industry | Male | Female |
| Agriculture, Fishing & Hunting | 18 (100.0%) | 0 (0.0%) |
| Mining, Quarrying, & Extraction | 0 (0.0%) | 0 (0.0%) |
| Construction | 62 (83.8%) | 12 (16.2%) |
| Manufacturing | 14 (100.0%) | 0 (0.0%) |
| Wholesale Trade | 0 (0.0%) | 0 (0.0%) |
| Retail Trade | 14 (31.8%) | 30 (68.2%) |
| Transportation & Warehousing | 17 (100.0%) | 0 (0.0%) |
| Utilities | 0 (0.0%) | 0 (0.0%) |
| Information | 0 (0.0%) | 0 (0.0%) |
| Finance & Insurance | 0 (0.0%) | 0 (0.0%) |
| Real Estate, Rental & Leasing | 0 (0.0%) | 16 (100.0%) |
| Professional & Scientific | 0 (0.0%) | 14 (100.0%) |
| Enterprise Management | 0 (0.0%) | 0 (0.0%) |
| Administrative & Support | 18 (100.0%) | 0 (0.0%) |
| Educational Services | 106 (41.4%) | 150 (58.6%) |
| Health Care & Social Assistance | 0 (0.0%) | 12 (100.0%) |
| Arts, Entertainment & Recreation | 0 (0.0%) | 0 (0.0%) |
| Accommodation & Food Services | 59 (53.1%) | 52 (46.9%) |
| Public Administration | 22 (100.0%) | 0 (0.0%) |
| Total | 330 (52.7%) | 296 (47.3%) |
Education in Kittery Point
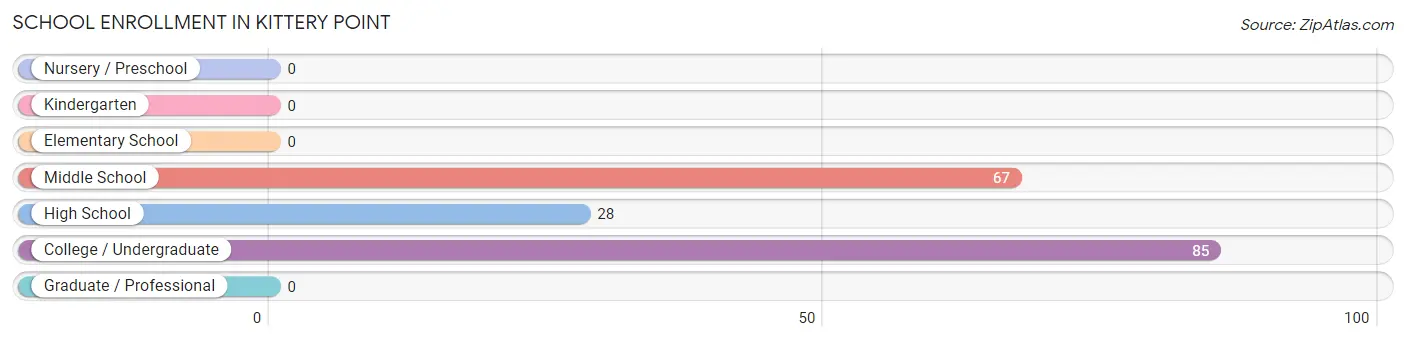
School Enrollment in Kittery Point
The most common levels of schooling among the 180 students in Kittery Point are college / undergraduate (85 | 47.2%), middle school (67 | 37.2%), and high school (28 | 15.6%).
| School Level | # Students | % Students |
| Nursery / Preschool | 0 | 0.0% |
| Kindergarten | 0 | 0.0% |
| Elementary School | 0 | 0.0% |
| Middle School | 67 | 37.2% |
| High School | 28 | 15.6% |
| College / Undergraduate | 85 | 47.2% |
| Graduate / Professional | 0 | 0.0% |
| Total | 180 | 100.0% |
School Enrollment by Age by Funding Source in Kittery Point
Out of a total of 180 students who are enrolled in schools in Kittery Point, 69 (38.3%) attend a private institution, while the remaining 111 (61.7%) are enrolled in public schools. The age group of 18 to 19 year olds has the highest likelihood of being enrolled in private schools, with 17 (100.0% in the age bracket) enrolled. Conversely, the age group of 10 to 14 year olds has the lowest likelihood of being enrolled in a private school, with 67 (100.0% in the age bracket) attending a public institution.
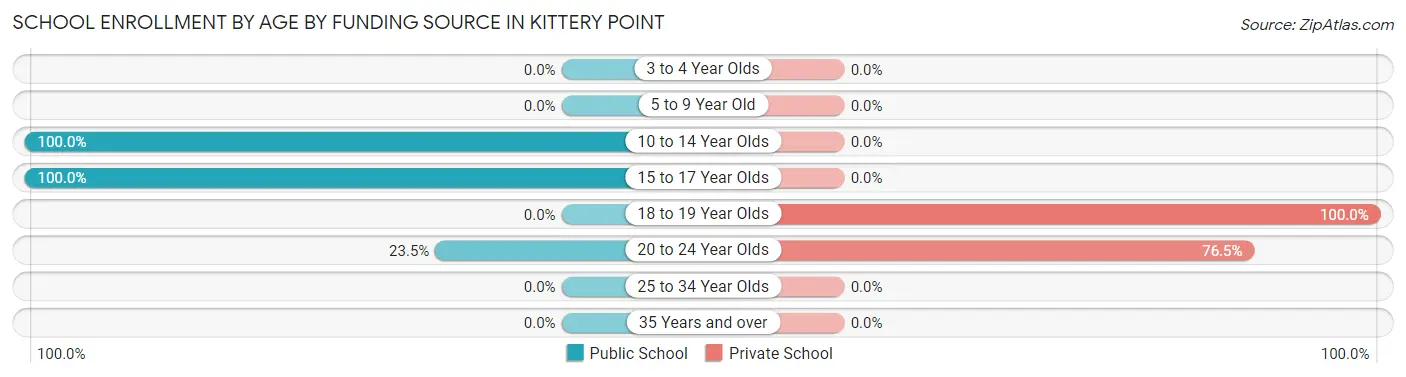
| Age Bracket | Public School | Private School |
| 3 to 4 Year Olds | 0 (0.0%) | 0 (0.0%) |
| 5 to 9 Year Old | 0 (0.0%) | 0 (0.0%) |
| 10 to 14 Year Olds | 67 (100.0%) | 0 (0.0%) |
| 15 to 17 Year Olds | 28 (100.0%) | 0 (0.0%) |
| 18 to 19 Year Olds | 0 (0.0%) | 17 (100.0%) |
| 20 to 24 Year Olds | 16 (23.5%) | 52 (76.5%) |
| 25 to 34 Year Olds | 0 (0.0%) | 0 (0.0%) |
| 35 Years and over | 0 (0.0%) | 0 (0.0%) |
| Total | 111 (61.7%) | 69 (38.3%) |
Educational Attainment by Field of Study in Kittery Point
Literature & languages (250 | 41.0%), liberal arts & history (133 | 21.8%), social sciences (53 | 8.7%), engineering (43 | 7.0%), and education (37 | 6.1%) are the most common fields of study among 610 individuals in Kittery Point who have obtained a bachelor's degree or higher.
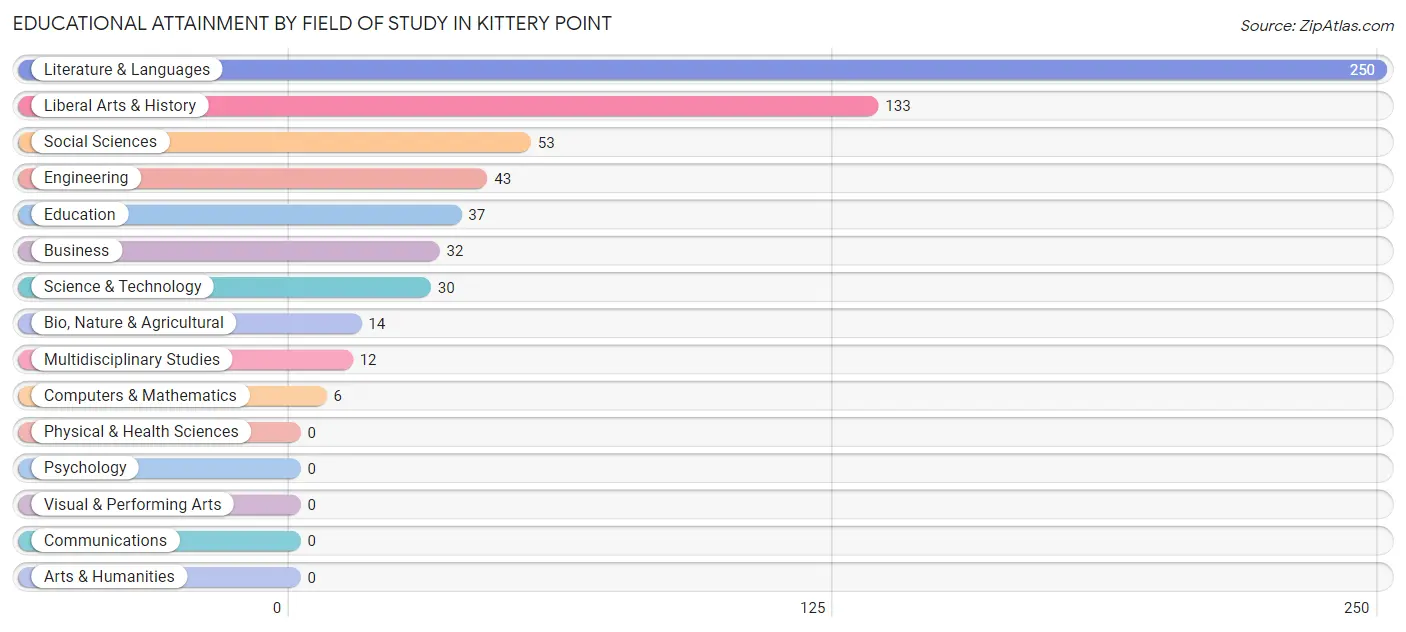
| Field of Study | # Graduates | % Graduates |
| Computers & Mathematics | 6 | 1.0% |
| Bio, Nature & Agricultural | 14 | 2.3% |
| Physical & Health Sciences | 0 | 0.0% |
| Psychology | 0 | 0.0% |
| Social Sciences | 53 | 8.7% |
| Engineering | 43 | 7.0% |
| Multidisciplinary Studies | 12 | 2.0% |
| Science & Technology | 30 | 4.9% |
| Business | 32 | 5.2% |
| Education | 37 | 6.1% |
| Literature & Languages | 250 | 41.0% |
| Liberal Arts & History | 133 | 21.8% |
| Visual & Performing Arts | 0 | 0.0% |
| Communications | 0 | 0.0% |
| Arts & Humanities | 0 | 0.0% |
| Total | 610 | 100.0% |
Transportation & Commute in Kittery Point
Vehicle Availability by Sex in Kittery Point
The most prevalent vehicle ownership categories in Kittery Point are males with 1 vehicle (149, accounting for 49.0%) and females with 1 vehicle (145, making up 52.1%).
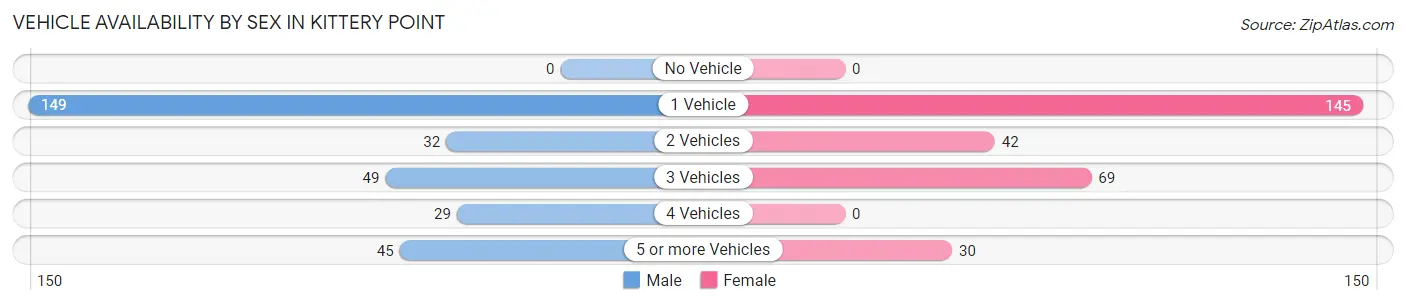
| Vehicles Available | Male | Female |
| No Vehicle | 0 (0.0%) | 0 (0.0%) |
| 1 Vehicle | 149 (49.0%) | 145 (50.7%) |
| 2 Vehicles | 32 (10.5%) | 42 (14.7%) |
| 3 Vehicles | 49 (16.1%) | 69 (24.1%) |
| 4 Vehicles | 29 (9.5%) | 0 (0.0%) |
| 5 or more Vehicles | 45 (14.8%) | 30 (10.5%) |
| Total | 304 (100.0%) | 286 (100.0%) |
Commute Time in Kittery Point
The most frequently occuring commute durations in Kittery Point are 15 to 19 minutes (126 commuters, 37.6%), 20 to 24 minutes (52 commuters, 15.5%), and 5 to 9 minutes (45 commuters, 13.4%).
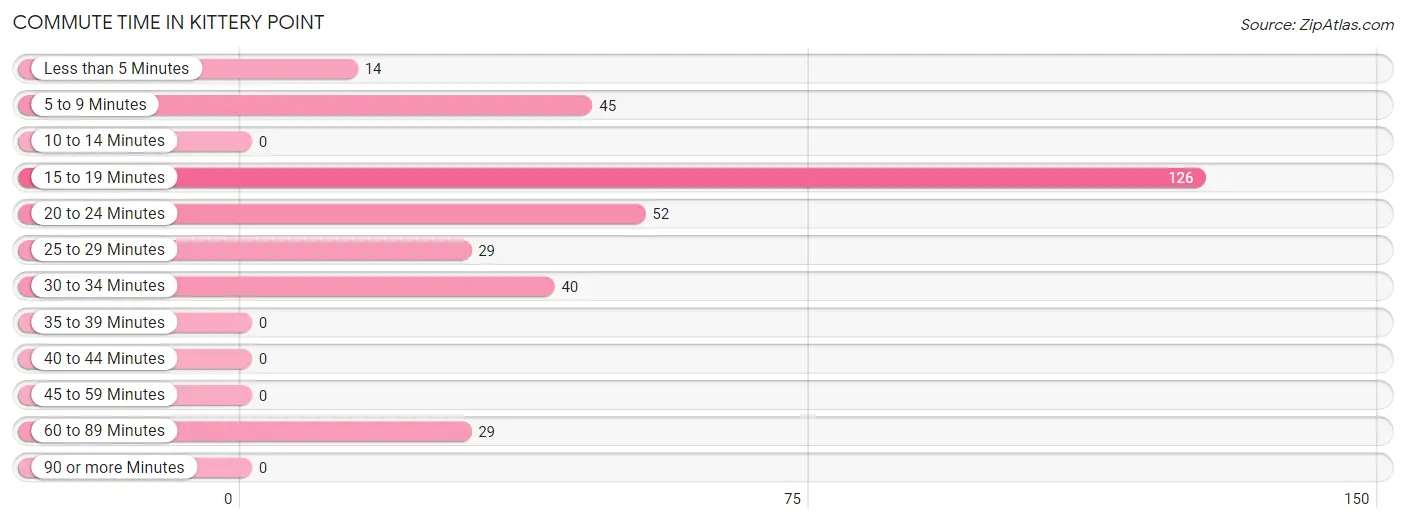
| Commute Time | # Commuters | % Commuters |
| Less than 5 Minutes | 14 | 4.2% |
| 5 to 9 Minutes | 45 | 13.4% |
| 10 to 14 Minutes | 0 | 0.0% |
| 15 to 19 Minutes | 126 | 37.6% |
| 20 to 24 Minutes | 52 | 15.5% |
| 25 to 29 Minutes | 29 | 8.7% |
| 30 to 34 Minutes | 40 | 11.9% |
| 35 to 39 Minutes | 0 | 0.0% |
| 40 to 44 Minutes | 0 | 0.0% |
| 45 to 59 Minutes | 0 | 0.0% |
| 60 to 89 Minutes | 29 | 8.7% |
| 90 or more Minutes | 0 | 0.0% |
Commute Time by Sex in Kittery Point
The most common commute times in Kittery Point are 20 to 24 minutes (52 commuters, 26.3%) for males and 15 to 19 minutes (95 commuters, 69.3%) for females.
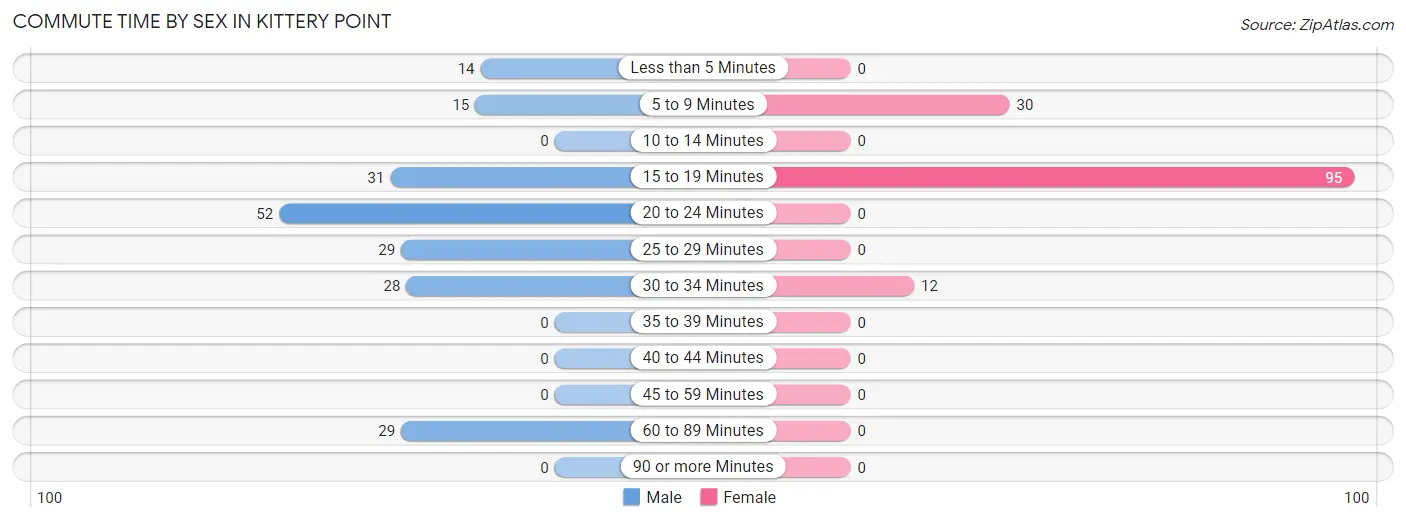
| Commute Time | Male | Female |
| Less than 5 Minutes | 14 (7.1%) | 0 (0.0%) |
| 5 to 9 Minutes | 15 (7.6%) | 30 (21.9%) |
| 10 to 14 Minutes | 0 (0.0%) | 0 (0.0%) |
| 15 to 19 Minutes | 31 (15.7%) | 95 (69.3%) |
| 20 to 24 Minutes | 52 (26.3%) | 0 (0.0%) |
| 25 to 29 Minutes | 29 (14.6%) | 0 (0.0%) |
| 30 to 34 Minutes | 28 (14.1%) | 12 (8.8%) |
| 35 to 39 Minutes | 0 (0.0%) | 0 (0.0%) |
| 40 to 44 Minutes | 0 (0.0%) | 0 (0.0%) |
| 45 to 59 Minutes | 0 (0.0%) | 0 (0.0%) |
| 60 to 89 Minutes | 29 (14.6%) | 0 (0.0%) |
| 90 or more Minutes | 0 (0.0%) | 0 (0.0%) |
Time of Departure to Work by Sex in Kittery Point
The most frequent times of departure to work in Kittery Point are 6:00 AM to 6:29 AM (81, 40.9%) for males and 7:30 AM to 7:59 AM (64, 46.7%) for females.
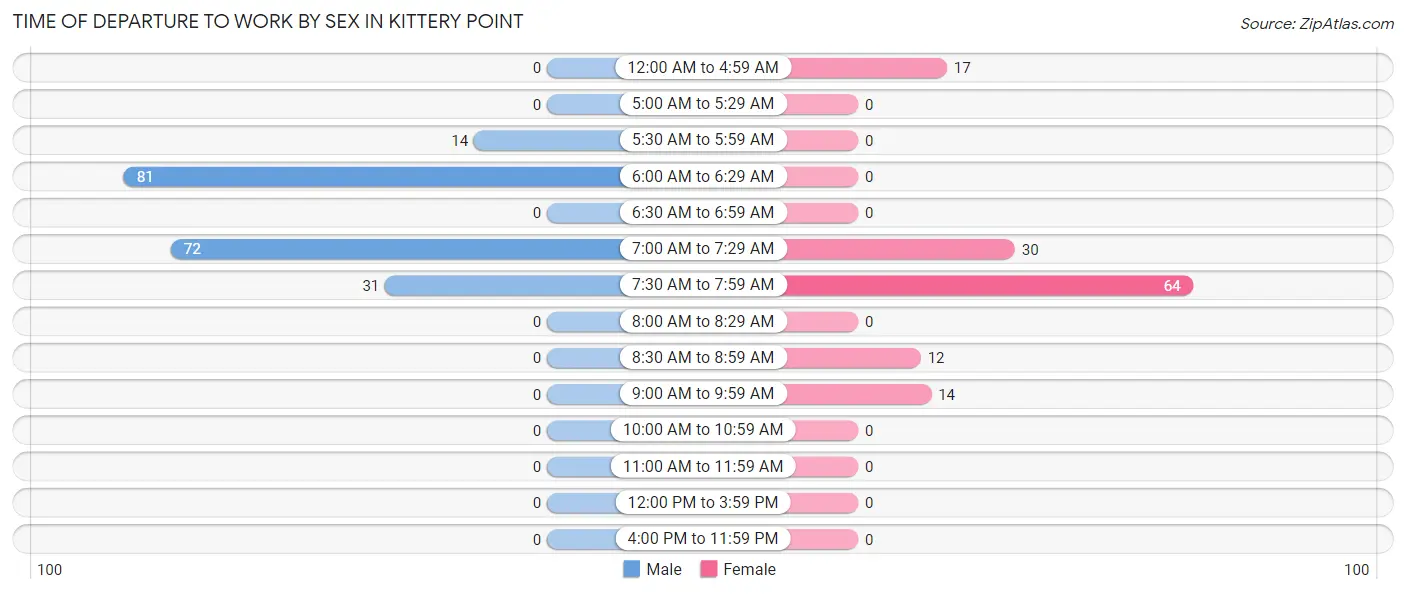
| Time of Departure | Male | Female |
| 12:00 AM to 4:59 AM | 0 (0.0%) | 17 (12.4%) |
| 5:00 AM to 5:29 AM | 0 (0.0%) | 0 (0.0%) |
| 5:30 AM to 5:59 AM | 14 (7.1%) | 0 (0.0%) |
| 6:00 AM to 6:29 AM | 81 (40.9%) | 0 (0.0%) |
| 6:30 AM to 6:59 AM | 0 (0.0%) | 0 (0.0%) |
| 7:00 AM to 7:29 AM | 72 (36.4%) | 30 (21.9%) |
| 7:30 AM to 7:59 AM | 31 (15.7%) | 64 (46.7%) |
| 8:00 AM to 8:29 AM | 0 (0.0%) | 0 (0.0%) |
| 8:30 AM to 8:59 AM | 0 (0.0%) | 12 (8.8%) |
| 9:00 AM to 9:59 AM | 0 (0.0%) | 14 (10.2%) |
| 10:00 AM to 10:59 AM | 0 (0.0%) | 0 (0.0%) |
| 11:00 AM to 11:59 AM | 0 (0.0%) | 0 (0.0%) |
| 12:00 PM to 3:59 PM | 0 (0.0%) | 0 (0.0%) |
| 4:00 PM to 11:59 PM | 0 (0.0%) | 0 (0.0%) |
| Total | 198 (100.0%) | 137 (100.0%) |
Housing Occupancy in Kittery Point
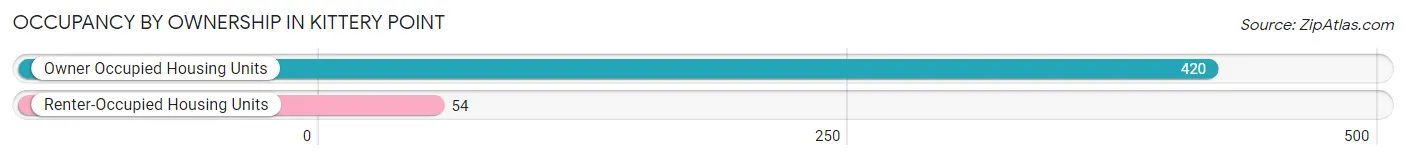
Occupancy by Ownership in Kittery Point
Of the total 474 dwellings in Kittery Point, owner-occupied units account for 420 (88.6%), while renter-occupied units make up 54 (11.4%).
| Occupancy | # Housing Units | % Housing Units |
| Owner Occupied Housing Units | 420 | 88.6% |
| Renter-Occupied Housing Units | 54 | 11.4% |
| Total Occupied Housing Units | 474 | 100.0% |
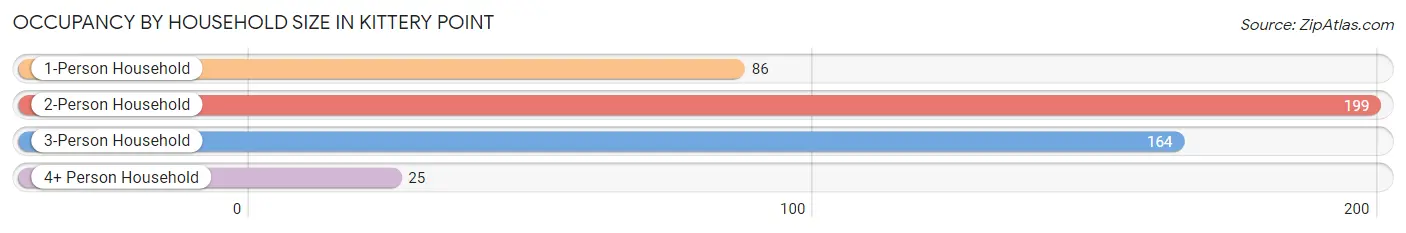
Occupancy by Household Size in Kittery Point
| Household Size | # Housing Units | % Housing Units |
| 1-Person Household | 86 | 18.1% |
| 2-Person Household | 199 | 42.0% |
| 3-Person Household | 164 | 34.6% |
| 4+ Person Household | 25 | 5.3% |
| Total Housing Units | 474 | 100.0% |
Occupancy by Ownership by Household Size in Kittery Point
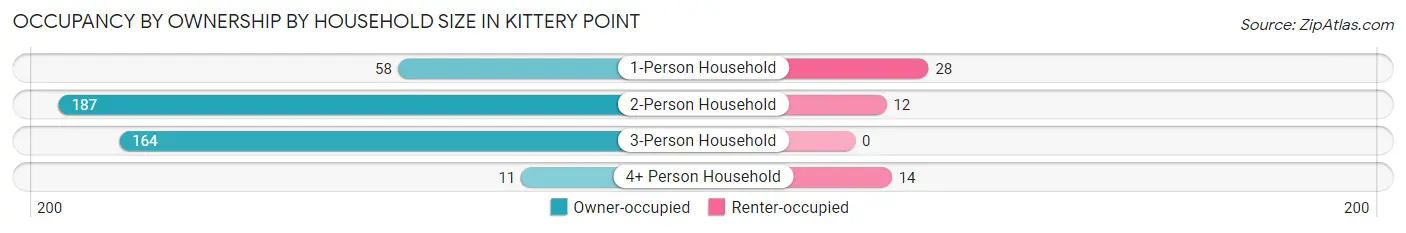
| Household Size | Owner-occupied | Renter-occupied |
| 1-Person Household | 58 (67.4%) | 28 (32.6%) |
| 2-Person Household | 187 (94.0%) | 12 (6.0%) |
| 3-Person Household | 164 (100.0%) | 0 (0.0%) |
| 4+ Person Household | 11 (44.0%) | 14 (56.0%) |
| Total Housing Units | 420 (88.6%) | 54 (11.4%) |
Occupancy by Educational Attainment in Kittery Point
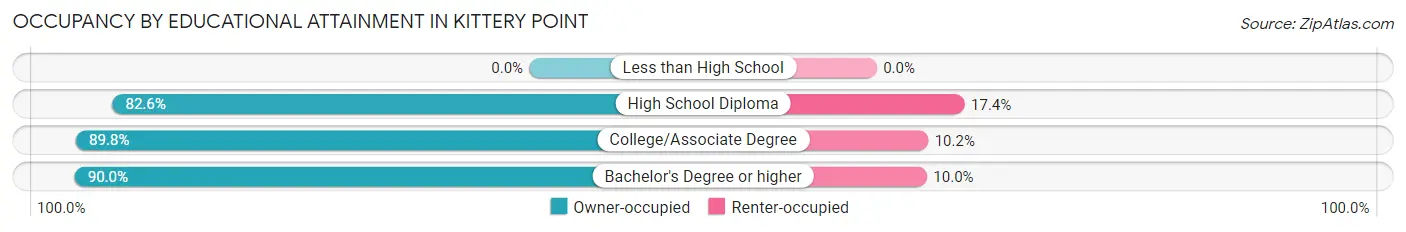
| Household Size | Owner-occupied | Renter-occupied |
| Less than High School | 0 (0.0%) | 0 (0.0%) |
| High School Diploma | 71 (82.6%) | 15 (17.4%) |
| College/Associate Degree | 123 (89.8%) | 14 (10.2%) |
| Bachelor's Degree or higher | 226 (90.0%) | 25 (10.0%) |
Occupancy by Age of Householder in Kittery Point
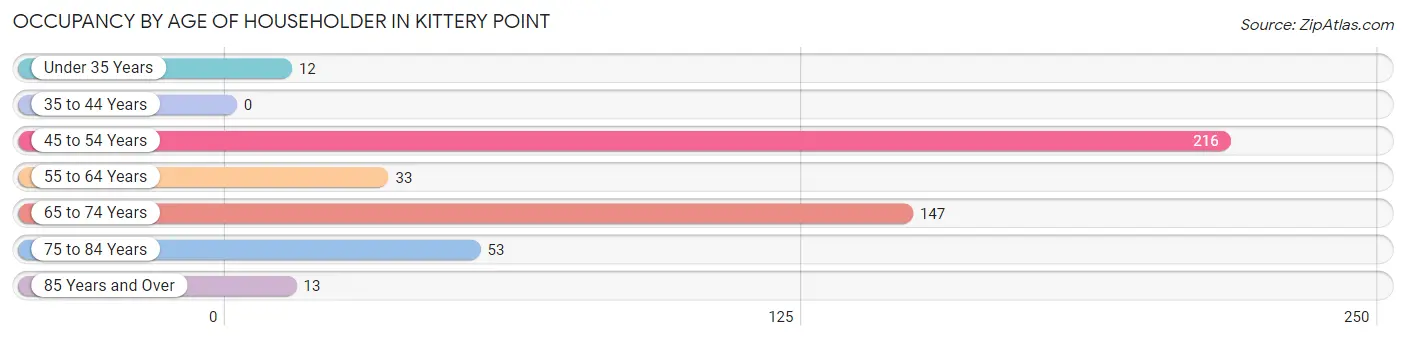
| Age Bracket | # Households | % Households |
| Under 35 Years | 12 | 2.5% |
| 35 to 44 Years | 0 | 0.0% |
| 45 to 54 Years | 216 | 45.6% |
| 55 to 64 Years | 33 | 7.0% |
| 65 to 74 Years | 147 | 31.0% |
| 75 to 84 Years | 53 | 11.2% |
| 85 Years and Over | 13 | 2.7% |
| Total | 474 | 100.0% |
Housing Finances in Kittery Point
Median Income by Occupancy in Kittery Point
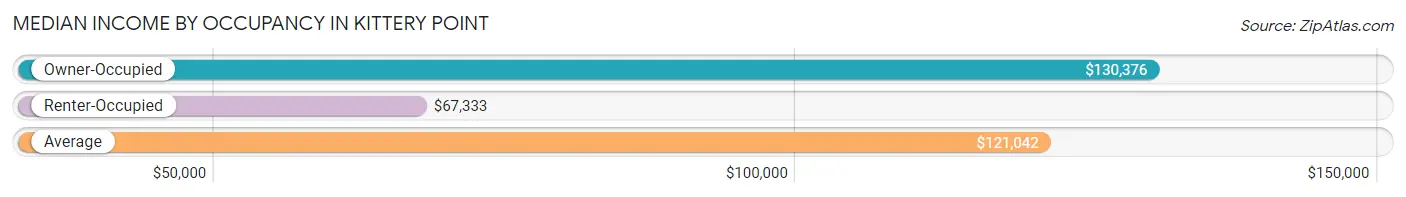
| Occupancy Type | # Households | Median Income |
| Owner-Occupied | 420 (88.6%) | $130,376 |
| Renter-Occupied | 54 (11.4%) | $67,333 |
| Average | 474 (100.0%) | $121,042 |
Occupancy by Householder Income Bracket in Kittery Point
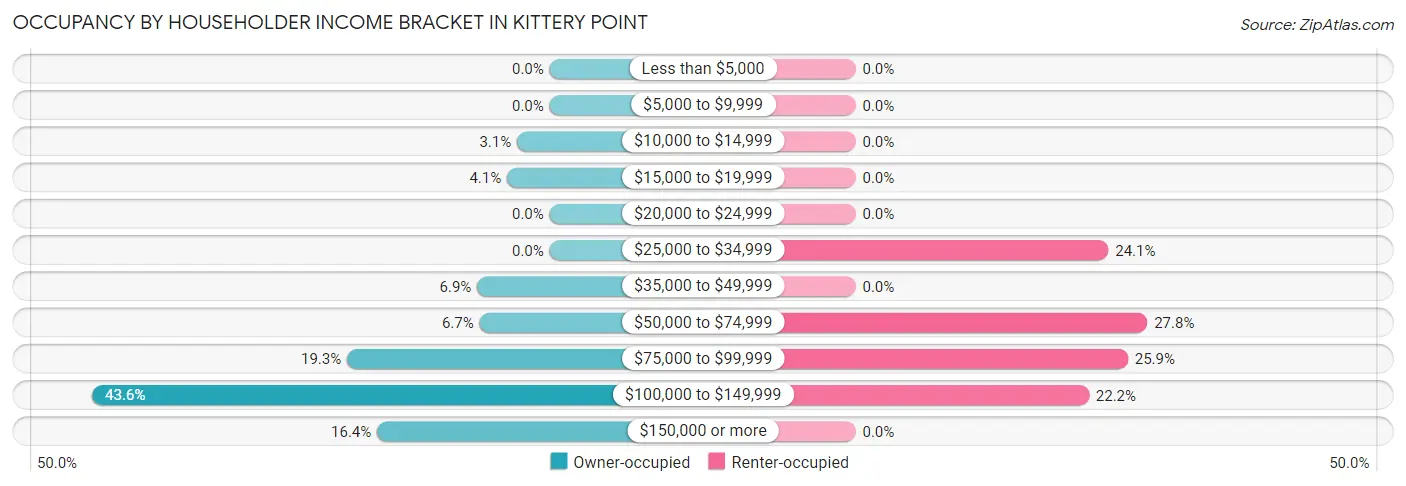
| Income Bracket | Owner-occupied | Renter-occupied |
| Less than $5,000 | 0 (0.0%) | 0 (0.0%) |
| $5,000 to $9,999 | 0 (0.0%) | 0 (0.0%) |
| $10,000 to $14,999 | 13 (3.1%) | 0 (0.0%) |
| $15,000 to $19,999 | 17 (4.1%) | 0 (0.0%) |
| $20,000 to $24,999 | 0 (0.0%) | 0 (0.0%) |
| $25,000 to $34,999 | 0 (0.0%) | 13 (24.1%) |
| $35,000 to $49,999 | 29 (6.9%) | 0 (0.0%) |
| $50,000 to $74,999 | 28 (6.7%) | 15 (27.8%) |
| $75,000 to $99,999 | 81 (19.3%) | 14 (25.9%) |
| $100,000 to $149,999 | 183 (43.6%) | 12 (22.2%) |
| $150,000 or more | 69 (16.4%) | 0 (0.0%) |
| Total | 420 (100.0%) | 54 (100.0%) |
Monthly Housing Cost Tiers in Kittery Point
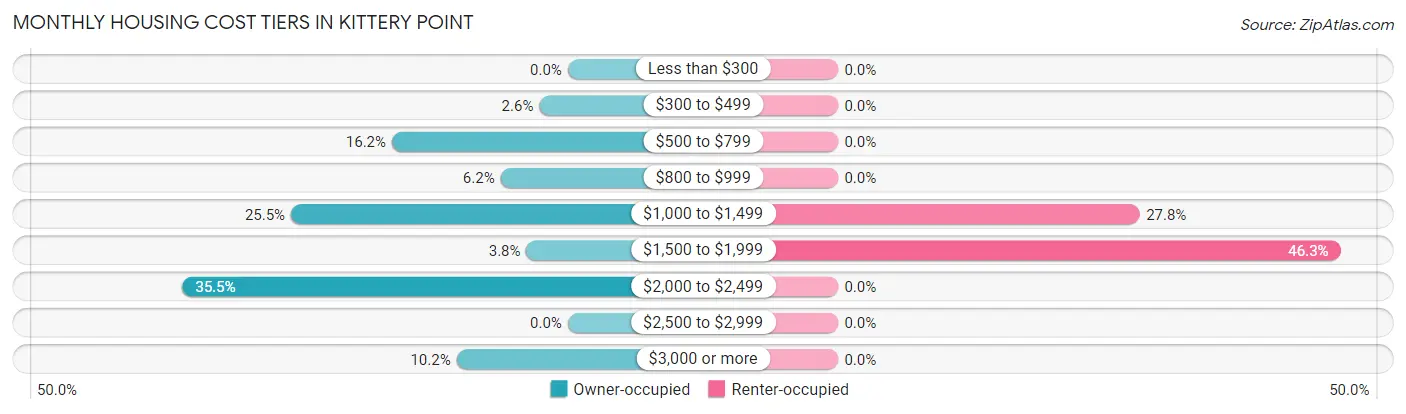
| Monthly Cost | Owner-occupied | Renter-occupied |
| Less than $300 | 0 (0.0%) | 0 (0.0%) |
| $300 to $499 | 11 (2.6%) | 0 (0.0%) |
| $500 to $799 | 68 (16.2%) | 0 (0.0%) |
| $800 to $999 | 26 (6.2%) | 0 (0.0%) |
| $1,000 to $1,499 | 107 (25.5%) | 15 (27.8%) |
| $1,500 to $1,999 | 16 (3.8%) | 25 (46.3%) |
| $2,000 to $2,499 | 149 (35.5%) | 0 (0.0%) |
| $2,500 to $2,999 | 0 (0.0%) | 0 (0.0%) |
| $3,000 or more | 43 (10.2%) | 0 (0.0%) |
| Total | 420 (100.0%) | 54 (100.0%) |
Physical Housing Characteristics in Kittery Point
Housing Structures in Kittery Point
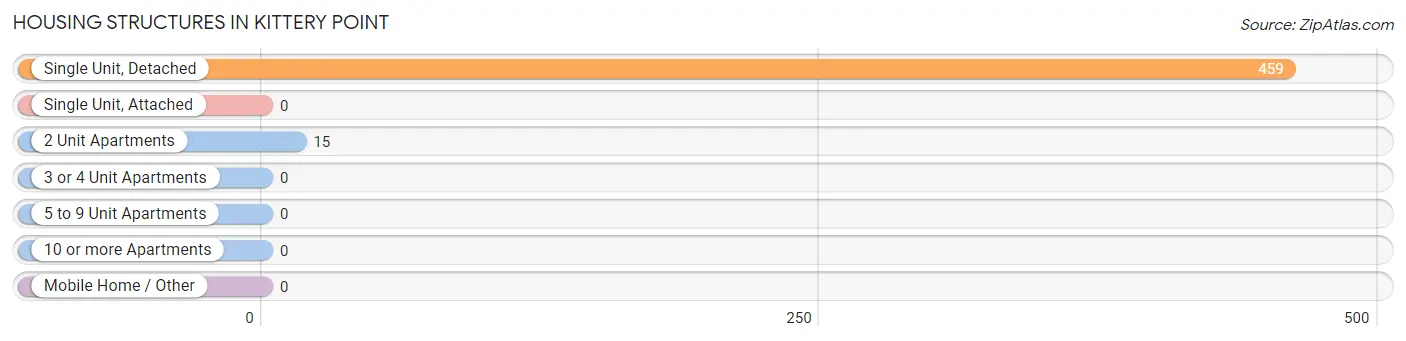
| Structure Type | # Housing Units | % Housing Units |
| Single Unit, Detached | 459 | 96.8% |
| Single Unit, Attached | 0 | 0.0% |
| 2 Unit Apartments | 15 | 3.2% |
| 3 or 4 Unit Apartments | 0 | 0.0% |
| 5 to 9 Unit Apartments | 0 | 0.0% |
| 10 or more Apartments | 0 | 0.0% |
| Mobile Home / Other | 0 | 0.0% |
| Total | 474 | 100.0% |
Housing Structures by Occupancy in Kittery Point
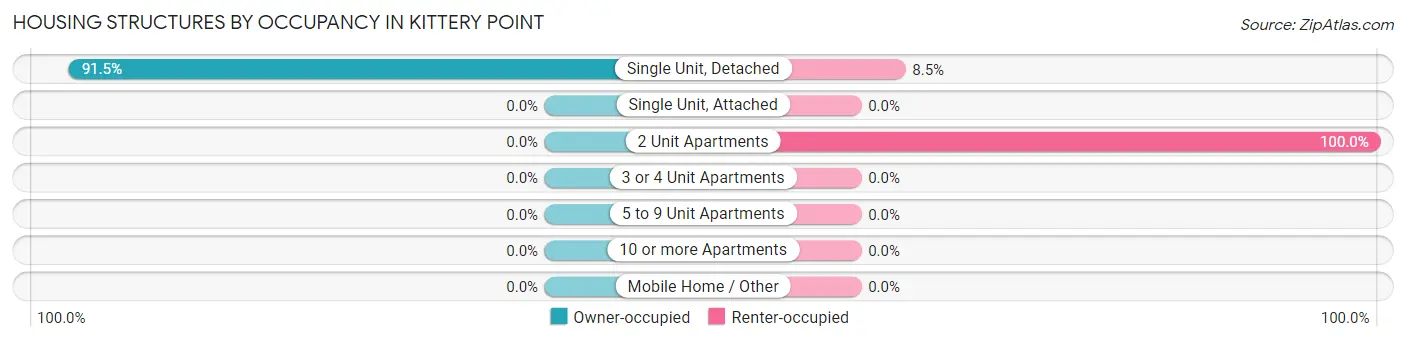
| Structure Type | Owner-occupied | Renter-occupied |
| Single Unit, Detached | 420 (91.5%) | 39 (8.5%) |
| Single Unit, Attached | 0 (0.0%) | 0 (0.0%) |
| 2 Unit Apartments | 0 (0.0%) | 15 (100.0%) |
| 3 or 4 Unit Apartments | 0 (0.0%) | 0 (0.0%) |
| 5 to 9 Unit Apartments | 0 (0.0%) | 0 (0.0%) |
| 10 or more Apartments | 0 (0.0%) | 0 (0.0%) |
| Mobile Home / Other | 0 (0.0%) | 0 (0.0%) |
| Total | 420 (88.6%) | 54 (11.4%) |
Housing Structures by Number of Rooms in Kittery Point
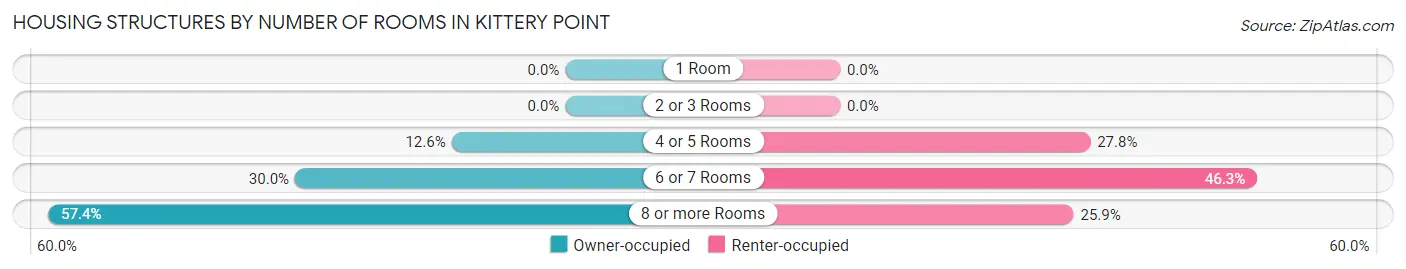
| Number of Rooms | Owner-occupied | Renter-occupied |
| 1 Room | 0 (0.0%) | 0 (0.0%) |
| 2 or 3 Rooms | 0 (0.0%) | 0 (0.0%) |
| 4 or 5 Rooms | 53 (12.6%) | 15 (27.8%) |
| 6 or 7 Rooms | 126 (30.0%) | 25 (46.3%) |
| 8 or more Rooms | 241 (57.4%) | 14 (25.9%) |
| Total | 420 (100.0%) | 54 (100.0%) |
Housing Structure by Heating Type in Kittery Point
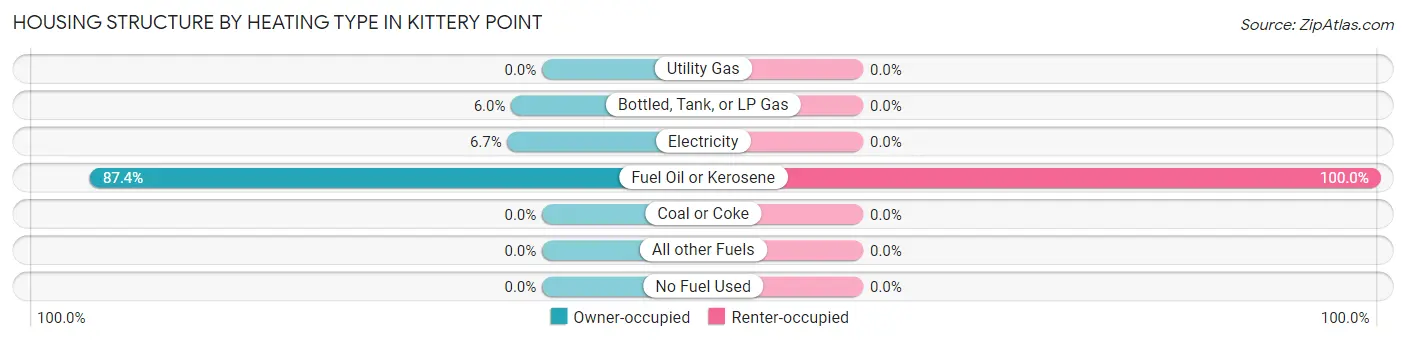
| Heating Type | Owner-occupied | Renter-occupied |
| Utility Gas | 0 (0.0%) | 0 (0.0%) |
| Bottled, Tank, or LP Gas | 25 (5.9%) | 0 (0.0%) |
| Electricity | 28 (6.7%) | 0 (0.0%) |
| Fuel Oil or Kerosene | 367 (87.4%) | 54 (100.0%) |
| Coal or Coke | 0 (0.0%) | 0 (0.0%) |
| All other Fuels | 0 (0.0%) | 0 (0.0%) |
| No Fuel Used | 0 (0.0%) | 0 (0.0%) |
| Total | 420 (100.0%) | 54 (100.0%) |
Household Vehicle Usage in Kittery Point
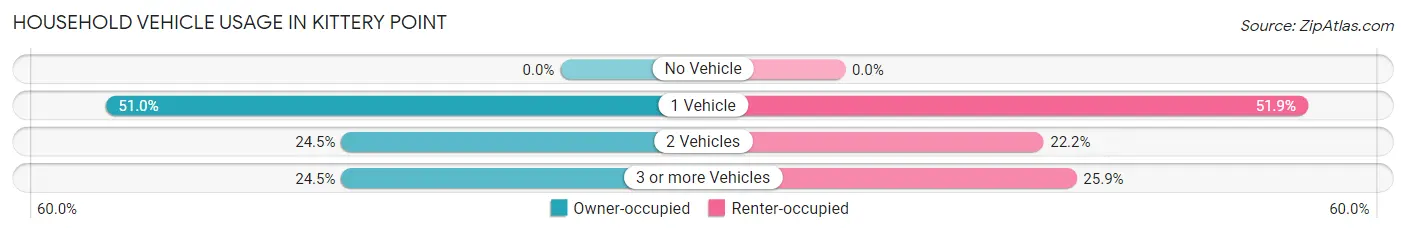
| Vehicles per Household | Owner-occupied | Renter-occupied |
| No Vehicle | 0 (0.0%) | 0 (0.0%) |
| 1 Vehicle | 214 (50.9%) | 28 (51.8%) |
| 2 Vehicles | 103 (24.5%) | 12 (22.2%) |
| 3 or more Vehicles | 103 (24.5%) | 14 (25.9%) |
| Total | 420 (100.0%) | 54 (100.0%) |
Real Estate & Mortgages in Kittery Point
Real Estate and Mortgage Overview in Kittery Point
| Characteristic | Without Mortgage | With Mortgage |
| Housing Units | 111 | 309 |
| Median Property Value | $404,500 | $443,700 |
| Median Household Income | $133,125 | $38 |
| Monthly Housing Costs | $738 | $43 |
| Real Estate Taxes | $4,580 | $0 |
Property Value by Mortgage Status in Kittery Point
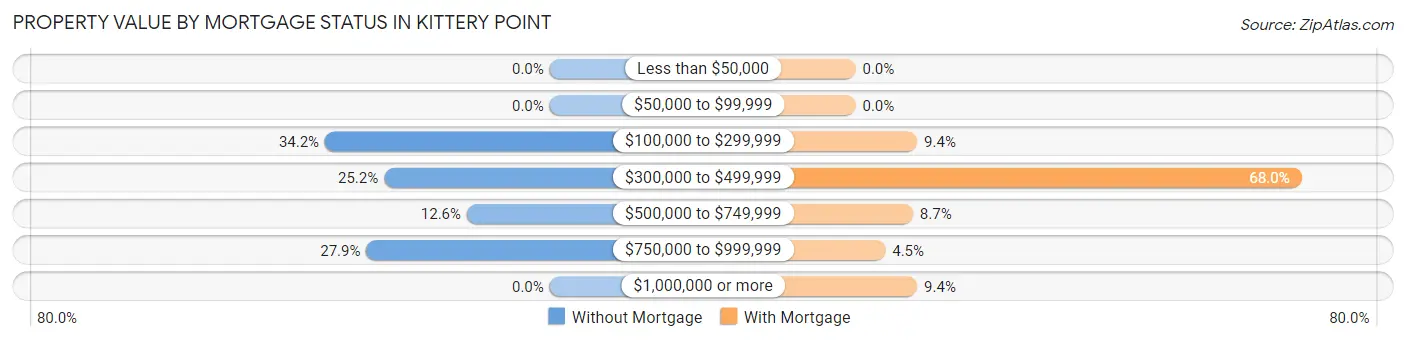
| Property Value | Without Mortgage | With Mortgage |
| Less than $50,000 | 0 (0.0%) | 0 (0.0%) |
| $50,000 to $99,999 | 0 (0.0%) | 0 (0.0%) |
| $100,000 to $299,999 | 38 (34.2%) | 29 (9.4%) |
| $300,000 to $499,999 | 28 (25.2%) | 210 (68.0%) |
| $500,000 to $749,999 | 14 (12.6%) | 27 (8.7%) |
| $750,000 to $999,999 | 31 (27.9%) | 14 (4.5%) |
| $1,000,000 or more | 0 (0.0%) | 29 (9.4%) |
| Total | 111 (100.0%) | 309 (100.0%) |
Household Income by Mortgage Status in Kittery Point
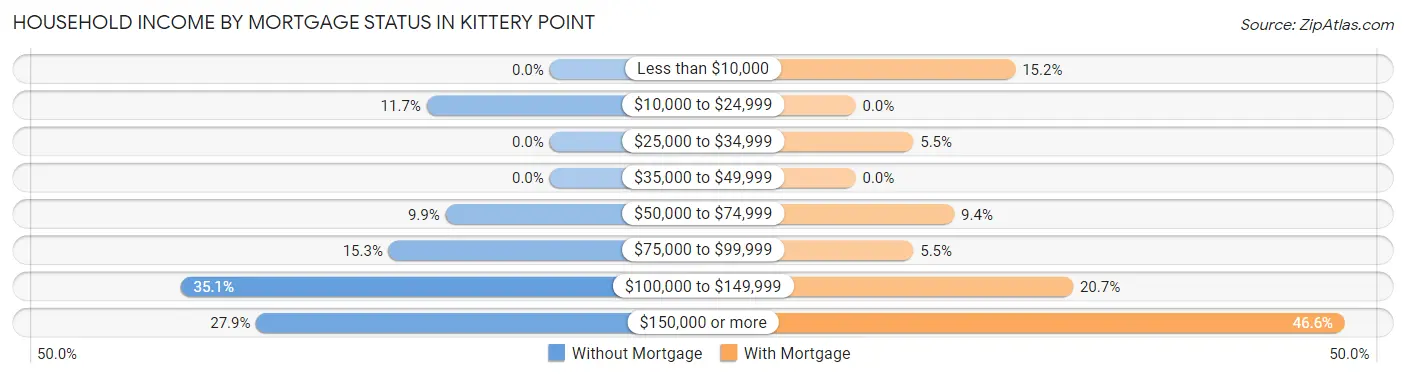
| Household Income | Without Mortgage | With Mortgage |
| Less than $10,000 | 0 (0.0%) | 47 (15.2%) |
| $10,000 to $24,999 | 13 (11.7%) | 0 (0.0%) |
| $25,000 to $34,999 | 0 (0.0%) | 17 (5.5%) |
| $35,000 to $49,999 | 0 (0.0%) | 0 (0.0%) |
| $50,000 to $74,999 | 11 (9.9%) | 29 (9.4%) |
| $75,000 to $99,999 | 17 (15.3%) | 17 (5.5%) |
| $100,000 to $149,999 | 39 (35.1%) | 64 (20.7%) |
| $150,000 or more | 31 (27.9%) | 144 (46.6%) |
| Total | 111 (100.0%) | 309 (100.0%) |
Property Value to Household Income Ratio in Kittery Point
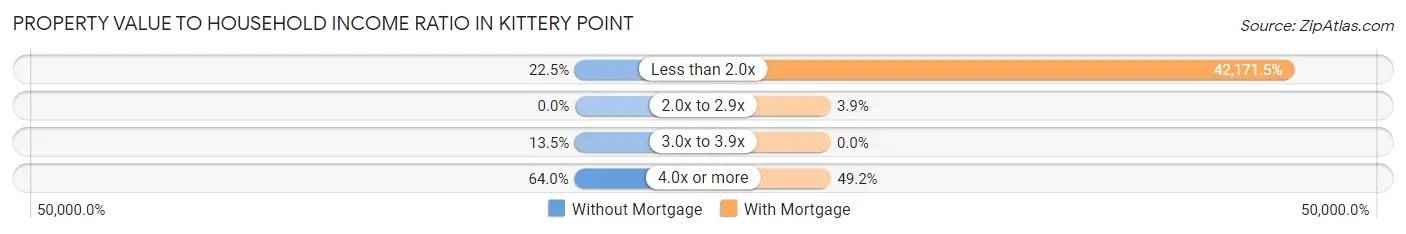
| Value-to-Income Ratio | Without Mortgage | With Mortgage |
| Less than 2.0x | 25 (22.5%) | 130,310 (42,171.5%) |
| 2.0x to 2.9x | 0 (0.0%) | 12 (3.9%) |
| 3.0x to 3.9x | 15 (13.5%) | 0 (0.0%) |
| 4.0x or more | 71 (64.0%) | 152 (49.2%) |
| Total | 111 (100.0%) | 309 (100.0%) |
Real Estate Taxes by Mortgage Status in Kittery Point
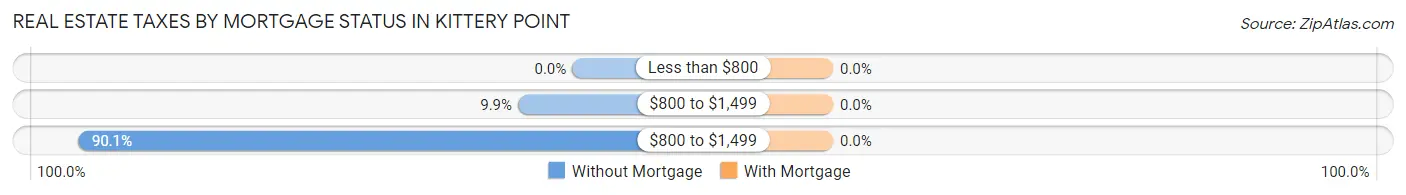
| Property Taxes | Without Mortgage | With Mortgage |
| Less than $800 | 0 (0.0%) | 0 (0.0%) |
| $800 to $1,499 | 11 (9.9%) | 0 (0.0%) |
| $800 to $1,499 | 100 (90.1%) | 0 (0.0%) |
| Total | 111 (100.0%) | 309 (100.0%) |
Health & Disability in Kittery Point
Health Insurance Coverage by Age in Kittery Point
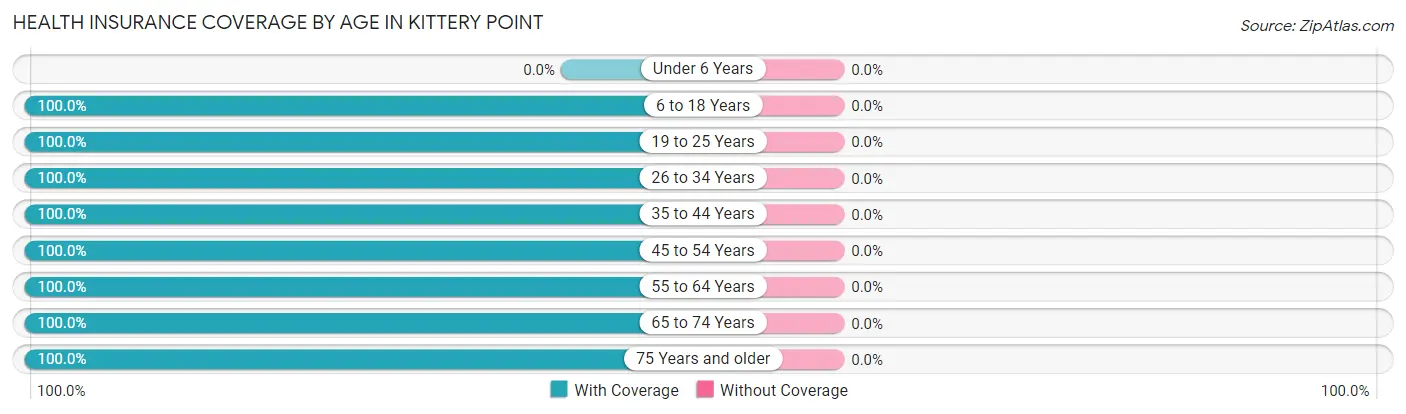
| Age Bracket | With Coverage | Without Coverage |
| Under 6 Years | 0 (0.0%) | 0 (0.0%) |
| 6 to 18 Years | 95 (100.0%) | 0 (0.0%) |
| 19 to 25 Years | 103 (100.0%) | 0 (0.0%) |
| 26 to 34 Years | 37 (100.0%) | 0 (0.0%) |
| 35 to 44 Years | 14 (100.0%) | 0 (0.0%) |
| 45 to 54 Years | 328 (100.0%) | 0 (0.0%) |
| 55 to 64 Years | 162 (100.0%) | 0 (0.0%) |
| 65 to 74 Years | 185 (100.0%) | 0 (0.0%) |
| 75 Years and older | 93 (100.0%) | 0 (0.0%) |
| Total | 1,017 (100.0%) | 0 (0.0%) |
Health Insurance Coverage by Citizenship Status in Kittery Point

| Citizenship Status | With Coverage | Without Coverage |
| Native Born | 0 (0.0%) | 0 (0.0%) |
| Foreign Born, Citizen | 95 (100.0%) | 0 (0.0%) |
| Foreign Born, not a Citizen | 103 (100.0%) | 0 (0.0%) |
Health Insurance Coverage by Household Income in Kittery Point
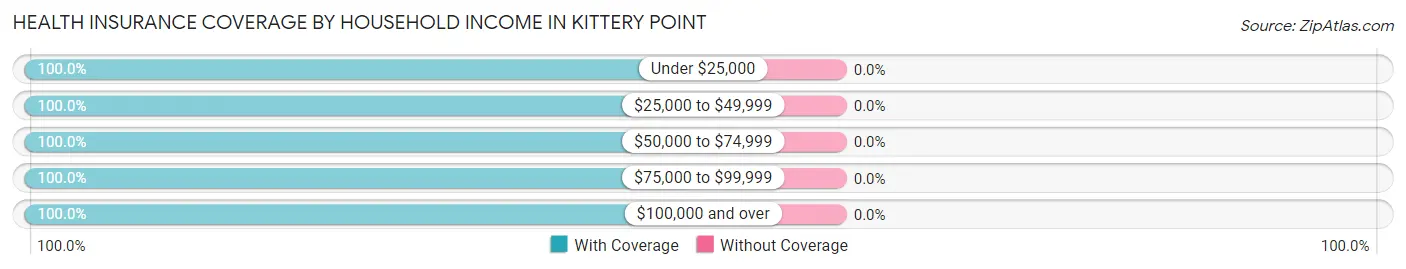
| Household Income | With Coverage | Without Coverage |
| Under $25,000 | 30 (100.0%) | 0 (0.0%) |
| $25,000 to $49,999 | 53 (100.0%) | 0 (0.0%) |
| $50,000 to $74,999 | 57 (100.0%) | 0 (0.0%) |
| $75,000 to $99,999 | 261 (100.0%) | 0 (0.0%) |
| $100,000 and over | 616 (100.0%) | 0 (0.0%) |
Public vs Private Health Insurance Coverage by Age in Kittery Point
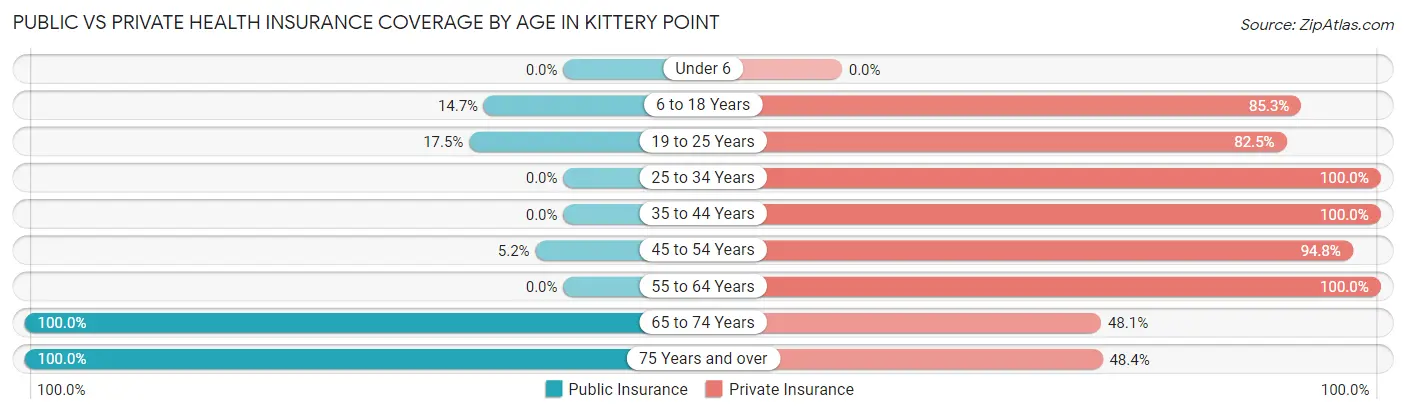
| Age Bracket | Public Insurance | Private Insurance |
| Under 6 | 0 (0.0%) | 0 (0.0%) |
| 6 to 18 Years | 14 (14.7%) | 81 (85.3%) |
| 19 to 25 Years | 18 (17.5%) | 85 (82.5%) |
| 25 to 34 Years | 0 (0.0%) | 37 (100.0%) |
| 35 to 44 Years | 0 (0.0%) | 14 (100.0%) |
| 45 to 54 Years | 17 (5.2%) | 311 (94.8%) |
| 55 to 64 Years | 0 (0.0%) | 162 (100.0%) |
| 65 to 74 Years | 185 (100.0%) | 89 (48.1%) |
| 75 Years and over | 93 (100.0%) | 45 (48.4%) |
| Total | 327 (32.2%) | 824 (81.0%) |
Disability Status by Sex by Age in Kittery Point
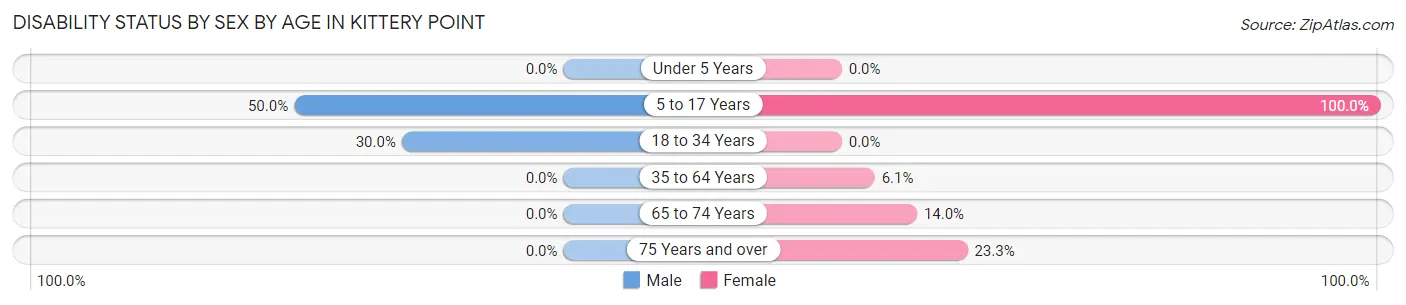
| Age Bracket | Male | Female |
| Under 5 Years | 0 (0.0%) | 0 (0.0%) |
| 5 to 17 Years | 14 (50.0%) | 67 (100.0%) |
| 18 to 34 Years | 18 (30.0%) | 0 (0.0%) |
| 35 to 64 Years | 0 (0.0%) | 16 (6.1%) |
| 65 to 74 Years | 0 (0.0%) | 12 (14.0%) |
| 75 Years and over | 0 (0.0%) | 14 (23.3%) |
Disability Class by Sex by Age in Kittery Point
Disability Class: Hearing Difficulty
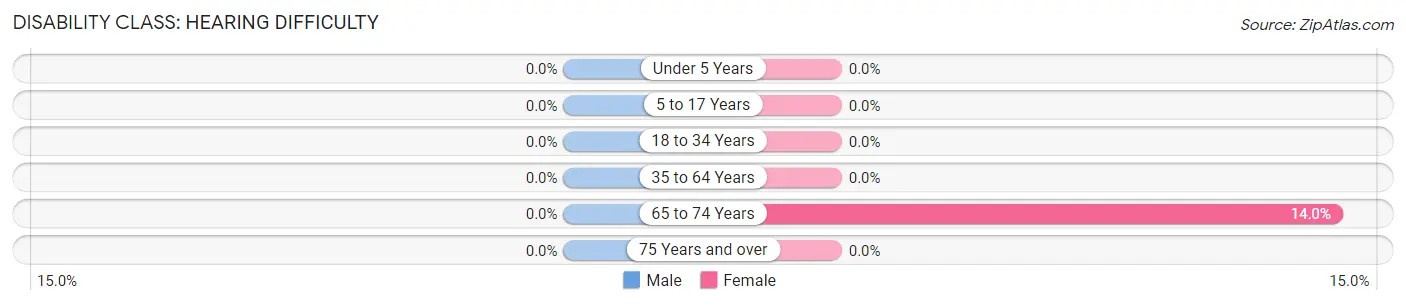
| Age Bracket | Male | Female |
| Under 5 Years | 0 (0.0%) | 0 (0.0%) |
| 5 to 17 Years | 0 (0.0%) | 0 (0.0%) |
| 18 to 34 Years | 0 (0.0%) | 0 (0.0%) |
| 35 to 64 Years | 0 (0.0%) | 0 (0.0%) |
| 65 to 74 Years | 0 (0.0%) | 12 (14.0%) |
| 75 Years and over | 0 (0.0%) | 0 (0.0%) |
Disability Class: Vision Difficulty
| Age Bracket | Male | Female |
| Under 5 Years | 0 (0.0%) | 0 (0.0%) |
| 5 to 17 Years | 0 (0.0%) | 0 (0.0%) |
| 18 to 34 Years | 0 (0.0%) | 0 (0.0%) |
| 35 to 64 Years | 0 (0.0%) | 0 (0.0%) |
| 65 to 74 Years | 0 (0.0%) | 0 (0.0%) |
| 75 Years and over | 0 (0.0%) | 0 (0.0%) |
Disability Class: Cognitive Difficulty
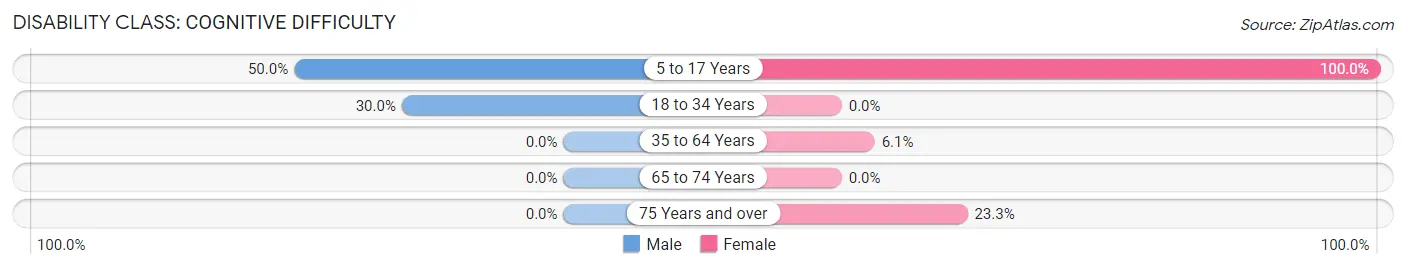
| Age Bracket | Male | Female |
| 5 to 17 Years | 14 (50.0%) | 67 (100.0%) |
| 18 to 34 Years | 18 (30.0%) | 0 (0.0%) |
| 35 to 64 Years | 0 (0.0%) | 16 (6.1%) |
| 65 to 74 Years | 0 (0.0%) | 0 (0.0%) |
| 75 Years and over | 0 (0.0%) | 14 (23.3%) |
Disability Class: Ambulatory Difficulty
| Age Bracket | Male | Female |
| 5 to 17 Years | 0 (0.0%) | 0 (0.0%) |
| 18 to 34 Years | 0 (0.0%) | 0 (0.0%) |
| 35 to 64 Years | 0 (0.0%) | 0 (0.0%) |
| 65 to 74 Years | 0 (0.0%) | 0 (0.0%) |
| 75 Years and over | 0 (0.0%) | 14 (23.3%) |
Disability Class: Self-Care Difficulty
| Age Bracket | Male | Female |
| 5 to 17 Years | 0 (0.0%) | 0 (0.0%) |
| 18 to 34 Years | 0 (0.0%) | 0 (0.0%) |
| 35 to 64 Years | 0 (0.0%) | 0 (0.0%) |
| 65 to 74 Years | 0 (0.0%) | 0 (0.0%) |
| 75 Years and over | 0 (0.0%) | 0 (0.0%) |
Technology Access in Kittery Point
Computing Device Access in Kittery Point
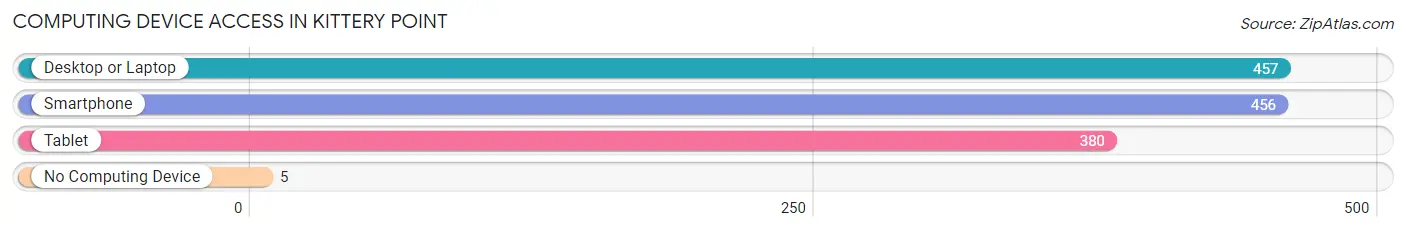
| Device Type | # Households | % Households |
| Desktop or Laptop | 457 | 96.4% |
| Smartphone | 456 | 96.2% |
| Tablet | 380 | 80.2% |
| No Computing Device | 5 | 1.1% |
| Total | 474 | 100.0% |
Internet Access in Kittery Point
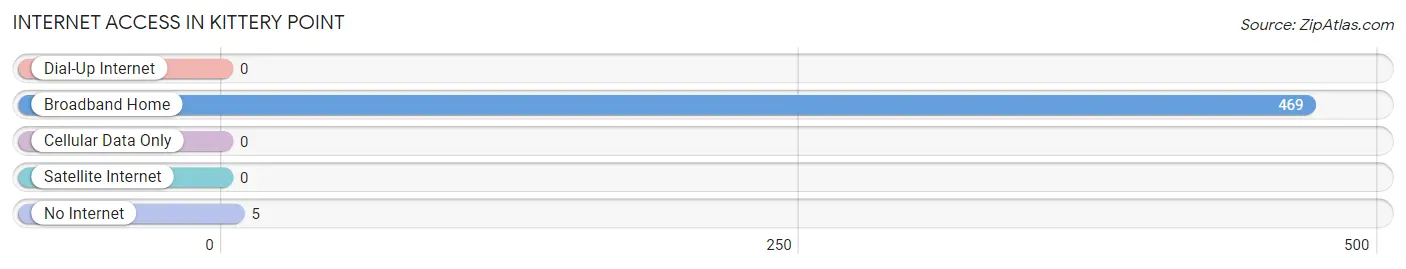
| Internet Type | # Households | % Households |
| Dial-Up Internet | 0 | 0.0% |
| Broadband Home | 469 | 99.0% |
| Cellular Data Only | 0 | 0.0% |
| Satellite Internet | 0 | 0.0% |
| No Internet | 5 | 1.1% |
| Total | 474 | 100.0% |
Kittery Point Summary
Kittery Point is a small town located in York County, Maine, United States. It is situated on the southern tip of the state, at the mouth of the Piscataqua River, which separates Maine from New Hampshire. The town is part of the Portland–South Portland–Biddeford, Maine metropolitan statistical area. As of the 2010 census, the town had a population of 1,012.
History
Kittery Point was first settled in 1623 by William Gorges and John Mason, two English explorers. The town was originally part of Kittery, Maine, but was incorporated as its own town in 1717. The town was named after the Kittery tribe of Native Americans, who lived in the area prior to the arrival of the Europeans.
Kittery Point was an important port during the American Revolution, and was the site of the first naval shipyard in the United States. The shipyard was established in 1776 and was used to build and repair ships for the Continental Navy. The town was also the site of the first U.S. Navy hospital, which was established in 1799.
Geography
Kittery Point is located at 43°5′17″N 70°41′17″W (43.088056, -70.688056). According to the United States Census Bureau, the town has a total area of 4.2 square miles (10.9 km2), of which 3.9 square miles (10.1 km2) is land and 0.3 square miles (0.8 km2) is water.
The town is situated on the southern tip of Maine, at the mouth of the Piscataqua River, which separates Maine from New Hampshire. The town is bordered by the towns of Eliot, Maine to the north, and Kittery, Maine to the east.
Economy
Kittery Point is a small, rural town with a limited economy. The town is home to several small businesses, including a few restaurants, a grocery store, and a few retail stores. The town is also home to the Portsmouth Naval Shipyard, which is the largest employer in the area. The shipyard employs over 4,000 people and is the largest employer in the state of Maine.
The town is also home to several marinas, which provide services to recreational boaters. The town is also home to a number of bed and breakfasts, which provide lodging for tourists.
Demographics
As of the 2010 census, there were 1,012 people, 441 households, and 287 families residing in the town. The population density was 259.2 people per square mile (100.0/km2). There were 486 housing units at an average density of 124.3 per square mile (48.0/km2). The racial makeup of the town was 97.3% White, 0.7% African American, 0.2% Native American, 0.4% Asian, 0.2% from other races, and 1.2% from two or more races. Hispanic or Latino of any race were 0.7% of the population.
There were 441 households, out of which 24.3% had children under the age of 18 living with them, 54.2% were married couples living together, 8.6% had a female householder with no husband present, and 33.2% were non-families. 28.2% of all households were made up of individuals, and 11.6% had someone living alone who was 65 years of age or older. The average household size was 2.29 and the average family size was 2.78.
In the town, the population was spread out, with 20.2% under the age of 18, 5.7% from 18 to 24, 24.2% from 25 to 44, 32.2% from 45 to 64, and 17.7% who were 65 years of age or older. The median age was 44 years. For every 100 females, there were 94.2 males. For every 100 females age 18 and over, there were 91.2 males.
The median income for a household in the town was $50,000, and the median income for a family was $60,000. Males had a median income of $41,000 versus $30,000 for females. The per capita income for the town was $25,000. About 4.2% of families and 6.2% of the population were below the poverty line, including 8.3% of those under age 18 and 4.2% of those age 65 or over.
Common Questions
What is the Total Population of Kittery Point?
Total Population of Kittery Point is 1,017.
What is the Total Male Population of Kittery Point?
Total Male Population of Kittery Point is 462.
What is the Total Female Population of Kittery Point?
Total Female Population of Kittery Point is 555.
What is the Ratio of Males per 100 Females in Kittery Point?
There are 83.24 Males per 100 Females in Kittery Point.
What is the Ratio of Females per 100 Males in Kittery Point?
There are 120.13 Females per 100 Males in Kittery Point.
What is the Median Population Age in Kittery Point?
Median Population Age in Kittery Point is 52.4 Years.
What is the Average Family Size in Kittery Point
Average Family Size in Kittery Point is 2.4 People.
What is the Average Household Size in Kittery Point
Average Household Size in Kittery Point is 2.1 People.
What is Per Capita Income in Kittery Point?
Per Capita income in Kittery Point is $50,833.
What is the Median Family Income in Kittery Point?
Median Family Income in Kittery Point is $130,818.
What is the Median Household income in Kittery Point?
Median Household Income in Kittery Point is $121,042.
What is Income or Wage Gap in Kittery Point?
Income or Wage Gap in Kittery Point is 37.4%.
Women in Kittery Point earn 62.6 cents for every dollar earned by a man.
What is Inequality or Gini Index in Kittery Point?
Inequality or Gini Index in Kittery Point is 0.28.
How Large is the Labor Force in Kittery Point?
There are 632 People in the Labor Forcein in Kittery Point.
What is the Percentage of People in the Labor Force in Kittery Point?
66.5% of People are in the Labor Force in Kittery Point.
What is the Unemployment Rate in Kittery Point?
Unemployment Rate in Kittery Point is 0.9%.