Zip Codes with the Highest Percentage of Population Employed in Transportation & Warehousing in Silver Spring, MD
RELATED REPORTS & OPTIONS
Transportation & Warehousing
Silver Spring
Compare Zip Codes
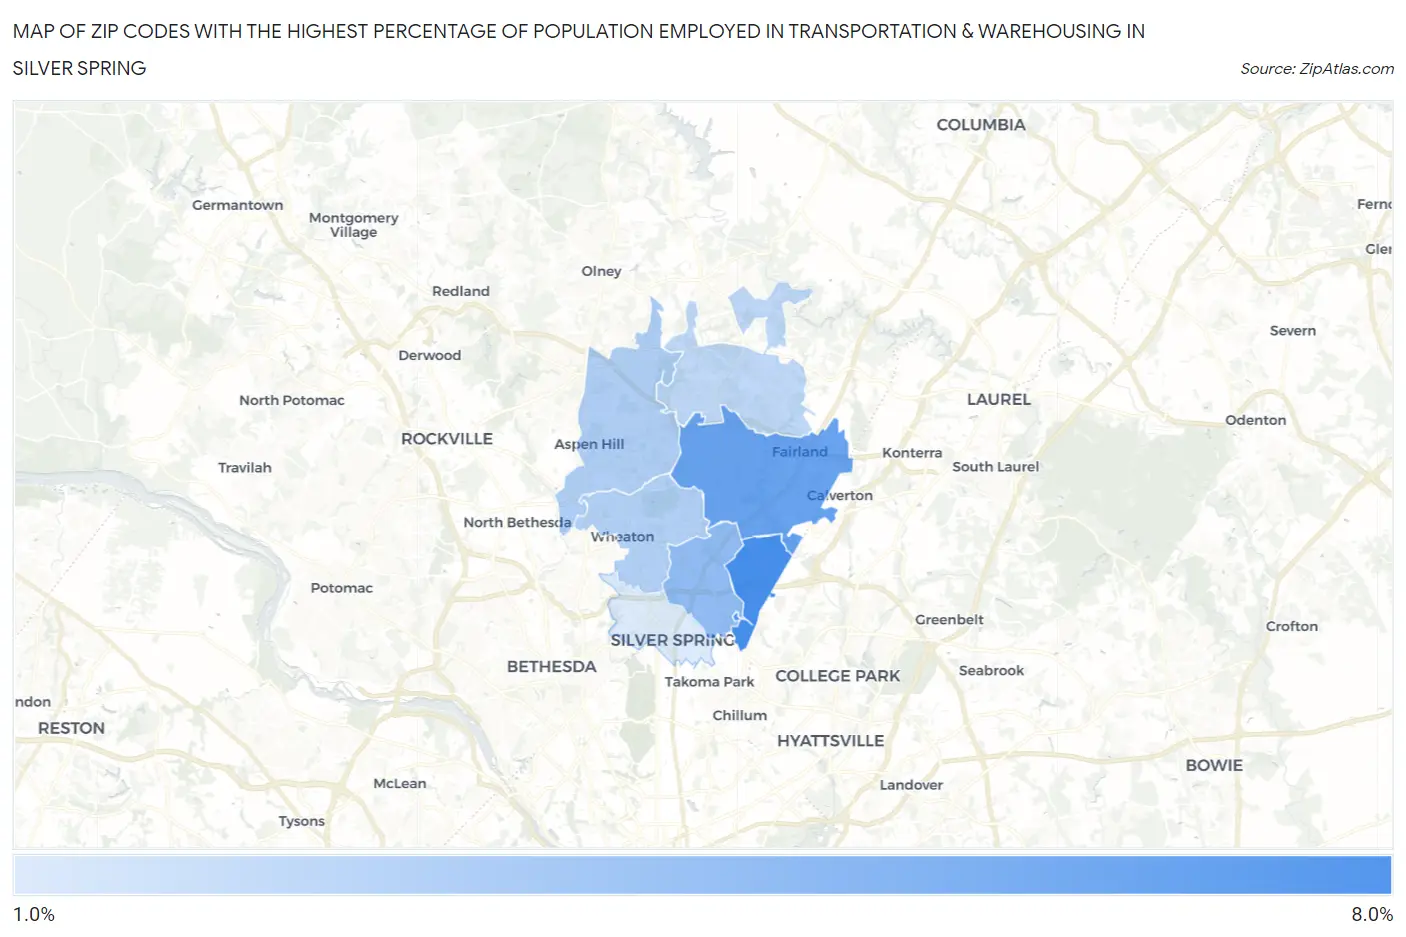
Map of Zip Codes with the Highest Percentage of Population Employed in Transportation & Warehousing in Silver Spring
1.9%
7.2%
Zip Codes with the Highest Percentage of Population Employed in Transportation & Warehousing in Silver Spring, MD
| Zip Code | % Employed | vs State | vs National | |
| 1. | 20903 | 7.2% | 4.4%(+2.79)#62 | 4.9%(+2.27)#6,159 |
| 2. | 20904 | 6.0% | 4.4%(+1.61)#91 | 4.9%(+1.10)#8,680 |
| 3. | 20901 | 4.5% | 4.4%(+0.112)#148 | 4.9%(-0.401)#13,619 |
| 4. | 20906 | 3.5% | 4.4%(-0.925)#213 | 4.9%(-1.44)#18,046 |
| 5. | 20902 | 3.3% | 4.4%(-1.09)#227 | 4.9%(-1.60)#18,729 |
| 6. | 20905 | 3.0% | 4.4%(-1.45)#252 | 4.9%(-1.96)#20,297 |
| 7. | 20910 | 1.9% | 4.4%(-2.51)#324 | 4.9%(-3.02)#24,515 |
1
Common Questions
What are the Top 5 Zip Codes with the Highest Percentage of Population Employed in Transportation & Warehousing in Silver Spring, MD?
Top 5 Zip Codes with the Highest Percentage of Population Employed in Transportation & Warehousing in Silver Spring, MD are:
What zip code has the Highest Percentage of Population Employed in Transportation & Warehousing in Silver Spring, MD?
20903 has the Highest Percentage of Population Employed in Transportation & Warehousing in Silver Spring, MD with 7.2%.
What is the Percentage of Population Employed in Transportation & Warehousing in Silver Spring, MD?
Percentage of Population Employed in Transportation & Warehousing in Silver Spring is 3.6%.
What is the Percentage of Population Employed in Transportation & Warehousing in Maryland?
Percentage of Population Employed in Transportation & Warehousing in Maryland is 4.4%.
What is the Percentage of Population Employed in Transportation & Warehousing in the United States?
Percentage of Population Employed in Transportation & Warehousing in the United States is 4.9%.