Cities with the Highest Percentage of Population Employed in Professional & Scientific Services in Maryland
RELATED REPORTS & OPTIONS
Professional & Scientific Services
Maryland
Compare Cities
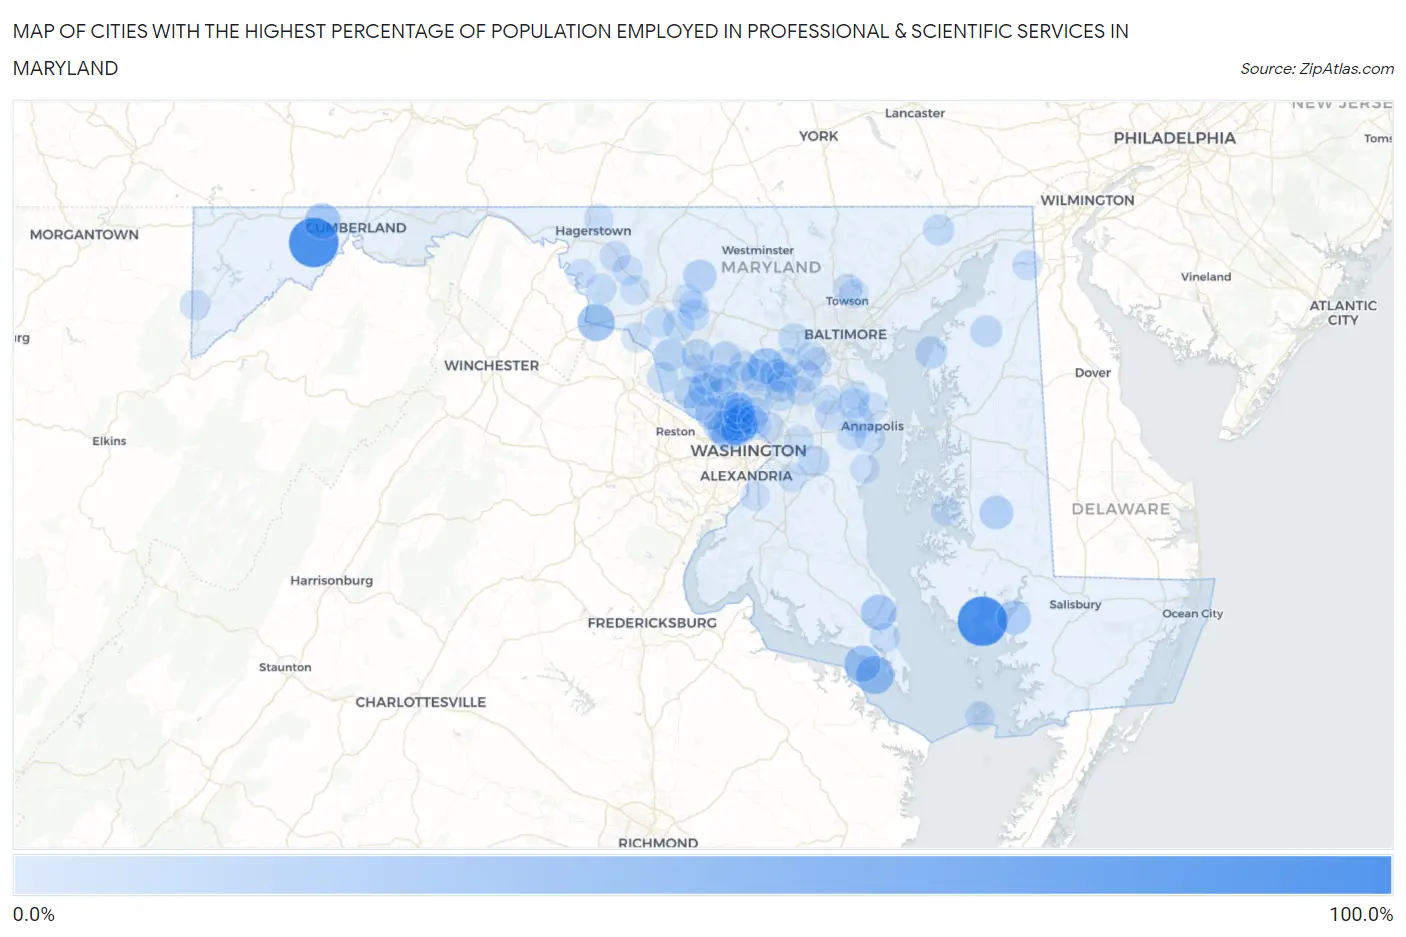
Map of Cities with the Highest Percentage of Population Employed in Professional & Scientific Services in Maryland
0.0%
100.0%
Cities with the Highest Percentage of Population Employed in Professional & Scientific Services in Maryland
| City | % Employed | vs State | vs National | |
| 1. | Elliott | 100.0% | 11.8%(+88.2)#1 | 7.8%(+92.2)#18 |
| 2. | Ocean | 100.0% | 11.8%(+88.2)#2 | 7.8%(+92.2)#21 |
| 3. | St George Island | 49.5% | 11.8%(+37.7)#3 | 7.8%(+41.6)#83 |
| 4. | Sandy Hook | 45.8% | 11.8%(+34.1)#4 | 7.8%(+38.0)#95 |
| 5. | Highland | 42.4% | 11.8%(+30.6)#5 | 7.8%(+34.5)#116 |
| 6. | Tall Timbers | 42.1% | 11.8%(+30.4)#6 | 7.8%(+34.3)#118 |
| 7. | Zihlman | 39.8% | 11.8%(+28.1)#7 | 7.8%(+32.0)#128 |
| 8. | Chevy Chase Section Three | 39.0% | 11.8%(+27.2)#8 | 7.8%(+31.1)#138 |
| 9. | Solomons | 38.5% | 11.8%(+26.8)#9 | 7.8%(+30.7)#140 |
| 10. | Chevy Chase Section Five | 38.1% | 11.8%(+26.4)#10 | 7.8%(+30.3)#145 |
| 11. | Chevy Chase Village | 34.0% | 11.8%(+22.3)#11 | 7.8%(+26.2)#196 |
| 12. | Glen Echo | 33.6% | 11.8%(+21.8)#12 | 7.8%(+25.7)#201 |
| 13. | Tyaskin | 33.3% | 11.8%(+21.6)#13 | 7.8%(+25.5)#207 |
| 14. | Garrett Park | 30.5% | 11.8%(+18.8)#14 | 7.8%(+22.7)#268 |
| 15. | Choptank | 30.4% | 11.8%(+18.7)#15 | 7.8%(+22.6)#269 |
| 16. | Somerset | 30.1% | 11.8%(+18.3)#16 | 7.8%(+22.3)#274 |
| 17. | North Potomac | 29.3% | 11.8%(+17.5)#17 | 7.8%(+21.4)#299 |
| 18. | Martin S Additions | 28.5% | 11.8%(+16.7)#18 | 7.8%(+20.6)#316 |
| 19. | Libertytown | 28.4% | 11.8%(+16.6)#19 | 7.8%(+20.5)#320 |
| 20. | Bethesda | 28.0% | 11.8%(+16.2)#20 | 7.8%(+20.1)#339 |
| 21. | Cabin John | 27.9% | 11.8%(+16.2)#21 | 7.8%(+20.1)#342 |
| 22. | Travilah | 27.6% | 11.8%(+15.9)#22 | 7.8%(+19.8)#354 |
| 23. | Fulton | 26.7% | 11.8%(+15.0)#23 | 7.8%(+18.9)#391 |
| 24. | Brookmont | 26.7% | 11.8%(+14.9)#24 | 7.8%(+18.8)#393 |
| 25. | Ashton Sandy Spring | 26.3% | 11.8%(+14.6)#25 | 7.8%(+18.5)#409 |
| 26. | Chevy Chase | 26.0% | 11.8%(+14.3)#26 | 7.8%(+18.2)#421 |
| 27. | Barnesville | 25.7% | 11.8%(+13.9)#27 | 7.8%(+17.8)#437 |
| 28. | Chevy Chase View | 25.3% | 11.8%(+13.6)#28 | 7.8%(+17.5)#447 |
| 29. | Darnestown | 25.2% | 11.8%(+13.4)#29 | 7.8%(+17.4)#451 |
| 30. | North Bethesda | 24.9% | 11.8%(+13.2)#30 | 7.8%(+17.1)#468 |
| 31. | North Chevy Chase | 24.4% | 11.8%(+12.7)#31 | 7.8%(+16.6)#495 |
| 32. | Potomac | 24.4% | 11.8%(+12.7)#32 | 7.8%(+16.6)#496 |
| 33. | Clarksburg | 24.0% | 11.8%(+12.2)#33 | 7.8%(+16.1)#520 |
| 34. | Ten Mile Creek | 23.8% | 11.8%(+12.1)#34 | 7.8%(+16.0)#523 |
| 35. | Tolchester | 23.8% | 11.8%(+12.0)#35 | 7.8%(+15.9)#526 |
| 36. | Jessup | 23.7% | 11.8%(+12.0)#36 | 7.8%(+15.9)#529 |
| 37. | Laytonsville | 23.1% | 11.8%(+11.4)#37 | 7.8%(+15.3)#574 |
| 38. | Brock Hall | 22.6% | 11.8%(+10.9)#38 | 7.8%(+14.8)#616 |
| 39. | Kennedyville | 22.3% | 11.8%(+10.6)#39 | 7.8%(+14.5)#637 |
| 40. | Wildewood | 22.2% | 11.8%(+10.5)#40 | 7.8%(+14.4)#641 |
| 41. | Scaggsville | 21.7% | 11.8%(+9.99)#41 | 7.8%(+13.9)#694 |
| 42. | Poolesville | 21.7% | 11.8%(+9.94)#42 | 7.8%(+13.8)#702 |
| 43. | Urbana | 21.2% | 11.8%(+9.49)#43 | 7.8%(+13.4)#748 |
| 44. | Darlington | 21.1% | 11.8%(+9.30)#44 | 7.8%(+13.2)#769 |
| 45. | Rockville | 21.0% | 11.8%(+9.28)#45 | 7.8%(+13.2)#777 |
| 46. | Monrovia | 21.0% | 11.8%(+9.28)#46 | 7.8%(+13.2)#779 |
| 47. | Ellicott City | 20.7% | 11.8%(+8.97)#47 | 7.8%(+12.9)#814 |
| 48. | South Kensington | 20.7% | 11.8%(+8.93)#48 | 7.8%(+12.8)#820 |
| 49. | Parole | 19.7% | 11.8%(+7.93)#49 | 7.8%(+11.8)#932 |
| 50. | Brookeville | 19.2% | 11.8%(+7.44)#50 | 7.8%(+11.3)#986 |
| 51. | Herald Harbor | 19.2% | 11.8%(+7.44)#51 | 7.8%(+11.3)#987 |
| 52. | Colesville | 19.0% | 11.8%(+7.26)#52 | 7.8%(+11.2)#1,021 |
| 53. | West Laurel | 18.9% | 11.8%(+7.15)#53 | 7.8%(+11.1)#1,040 |
| 54. | Konterra | 18.6% | 11.8%(+6.87)#54 | 7.8%(+10.8)#1,071 |
| 55. | University Park | 18.4% | 11.8%(+6.69)#55 | 7.8%(+10.6)#1,093 |
| 56. | Mount Lena | 18.4% | 11.8%(+6.69)#56 | 7.8%(+10.6)#1,095 |
| 57. | Olney | 18.1% | 11.8%(+6.39)#57 | 7.8%(+10.3)#1,148 |
| 58. | Mount Briar | 18.0% | 11.8%(+6.27)#58 | 7.8%(+10.2)#1,164 |
| 59. | Annapolis Neck | 17.9% | 11.8%(+6.17)#59 | 7.8%(+10.1)#1,178 |
| 60. | Buckeystown | 17.8% | 11.8%(+6.05)#60 | 7.8%(+9.95)#1,201 |
| 61. | Friendship Heights Village | 17.8% | 11.8%(+6.01)#61 | 7.8%(+9.91)#1,213 |
| 62. | Gaithersburg | 17.7% | 11.8%(+5.97)#62 | 7.8%(+9.87)#1,217 |
| 63. | Crellin | 17.7% | 11.8%(+5.95)#63 | 7.8%(+9.85)#1,220 |
| 64. | Lewistown | 17.7% | 11.8%(+5.94)#64 | 7.8%(+9.84)#1,229 |
| 65. | North Kensington | 17.3% | 11.8%(+5.55)#65 | 7.8%(+9.45)#1,311 |
| 66. | Elkridge | 17.3% | 11.8%(+5.53)#66 | 7.8%(+9.43)#1,317 |
| 67. | Lisbon | 17.1% | 11.8%(+5.39)#67 | 7.8%(+9.30)#1,345 |
| 68. | Four Corners | 17.0% | 11.8%(+5.29)#68 | 7.8%(+9.19)#1,364 |
| 69. | Green Valley | 17.0% | 11.8%(+5.26)#69 | 7.8%(+9.16)#1,369 |
| 70. | Myersville | 17.0% | 11.8%(+5.20)#70 | 7.8%(+9.11)#1,383 |
| 71. | Columbia | 16.9% | 11.8%(+5.17)#71 | 7.8%(+9.08)#1,386 |
| 72. | Lexington Park | 16.8% | 11.8%(+5.06)#72 | 7.8%(+8.96)#1,416 |
| 73. | Maryland City | 16.5% | 11.8%(+4.80)#73 | 7.8%(+8.70)#1,472 |
| 74. | Chesapeake City | 16.5% | 11.8%(+4.74)#74 | 7.8%(+8.65)#1,493 |
| 75. | Point Of Rocks | 16.5% | 11.8%(+4.72)#75 | 7.8%(+8.62)#1,496 |
| 76. | Timonium | 16.4% | 11.8%(+4.66)#76 | 7.8%(+8.56)#1,508 |
| 77. | Riva | 16.4% | 11.8%(+4.65)#77 | 7.8%(+8.55)#1,509 |
| 78. | Crofton | 16.3% | 11.8%(+4.53)#78 | 7.8%(+8.43)#1,540 |
| 79. | Washington Grove | 16.1% | 11.8%(+4.39)#79 | 7.8%(+8.29)#1,571 |
| 80. | Takoma Park | 16.1% | 11.8%(+4.34)#80 | 7.8%(+8.25)#1,579 |
| 81. | Germantown | 16.1% | 11.8%(+4.34)#81 | 7.8%(+8.24)#1,581 |
| 82. | Mitchellville | 16.0% | 11.8%(+4.29)#82 | 7.8%(+8.19)#1,593 |
| 83. | Linganore | 16.0% | 11.8%(+4.29)#83 | 7.8%(+8.19)#1,594 |
| 84. | Redland | 16.0% | 11.8%(+4.26)#84 | 7.8%(+8.16)#1,601 |
| 85. | Middletown | 15.8% | 11.8%(+4.06)#85 | 7.8%(+7.97)#1,644 |
| 86. | Arnold | 15.8% | 11.8%(+4.03)#86 | 7.8%(+7.93)#1,662 |
| 87. | Fort Washington | 15.7% | 11.8%(+3.96)#87 | 7.8%(+7.86)#1,679 |
| 88. | Ilchester | 15.7% | 11.8%(+3.95)#88 | 7.8%(+7.85)#1,683 |
| 89. | Severna Park | 15.7% | 11.8%(+3.94)#89 | 7.8%(+7.84)#1,688 |
| 90. | Callaway | 15.7% | 11.8%(+3.92)#90 | 7.8%(+7.83)#1,693 |
| 91. | Hampton | 15.6% | 11.8%(+3.89)#91 | 7.8%(+7.79)#1,702 |
| 92. | Odenton | 15.6% | 11.8%(+3.87)#92 | 7.8%(+7.78)#1,709 |
| 93. | Oxford | 15.6% | 11.8%(+3.81)#93 | 7.8%(+7.71)#1,721 |
| 94. | Shady Side | 15.5% | 11.8%(+3.77)#94 | 7.8%(+7.68)#1,723 |
| 95. | Smith Island | 15.5% | 11.8%(+3.73)#95 | 7.8%(+7.64)#1,733 |
| 96. | Mercersville | 15.5% | 11.8%(+3.70)#96 | 7.8%(+7.61)#1,742 |
| 97. | Paramount Long Meadow | 15.4% | 11.8%(+3.69)#97 | 7.8%(+7.59)#1,747 |
| 98. | New Market | 15.4% | 11.8%(+3.66)#98 | 7.8%(+7.57)#1,756 |
| 99. | Silver Spring | 15.4% | 11.8%(+3.65)#99 | 7.8%(+7.55)#1,759 |
| 100. | Melwood | 15.4% | 11.8%(+3.62)#100 | 7.8%(+7.52)#1,779 |
Common Questions
What are the Top 10 Cities with the Highest Percentage of Population Employed in Professional & Scientific Services in Maryland?
Top 10 Cities with the Highest Percentage of Population Employed in Professional & Scientific Services in Maryland are:
#1
100.0%
#2
100.0%
#3
49.5%
#4
45.8%
#5
42.4%
#6
42.1%
#7
39.8%
#8
39.0%
#9
38.5%
#10
38.1%
What city has the Highest Percentage of Population Employed in Professional & Scientific Services in Maryland?
Elliott has the Highest Percentage of Population Employed in Professional & Scientific Services in Maryland with 100.0%.
What is the Percentage of Population Employed in Professional & Scientific Services in the State of Maryland?
Percentage of Population Employed in Professional & Scientific Services in Maryland is 11.8%.
What is the Percentage of Population Employed in Professional & Scientific Services in the United States?
Percentage of Population Employed in Professional & Scientific Services in the United States is 7.8%.