Cities with the Highest Percentage of Renter-Occupied Units in Maryland
RELATED REPORTS & OPTIONS
Highest Renter-Occupied
Maryland
Compare Cities
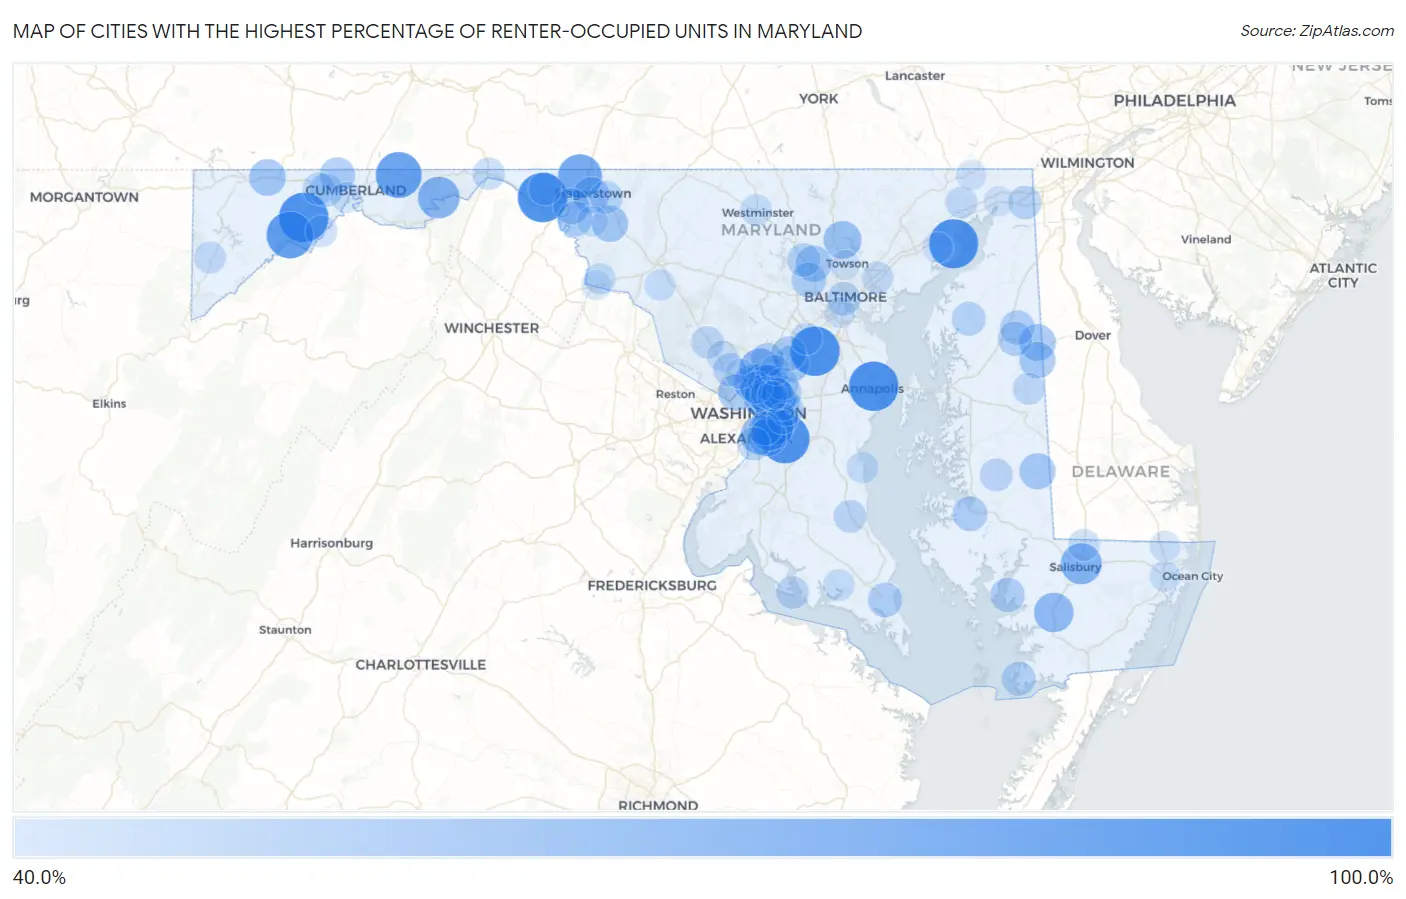
Map of Cities with the Highest Percentage of Renter-Occupied Units in Maryland
0.0%
100.0%
Cities with the Highest Percentage of Renter-Occupied Units in Maryland
| City | % Renter-Occupied | vs State | vs National | |
| 1. | Naval Academy | 100.0% | 32.5%(+67.5)#1 | 35.2%(+64.8)#40 |
| 2. | Detmold | 100.0% | 32.5%(+67.5)#2 | 35.2%(+64.8)#119 |
| 3. | Big Spring | 100.0% | 32.5%(+67.5)#3 | 35.2%(+64.8)#184 |
| 4. | Fort Meade | 99.8% | 32.5%(+67.2)#4 | 35.2%(+64.6)#237 |
| 5. | Andrews Afb | 99.0% | 32.5%(+66.4)#5 | 35.2%(+63.8)#254 |
| 6. | Aberdeen Proving Ground | 98.7% | 32.5%(+66.2)#6 | 35.2%(+63.5)#261 |
| 7. | Franklin | 91.6% | 32.5%(+59.0)#7 | 35.2%(+56.4)#316 |
| 8. | Flintstone | 88.6% | 32.5%(+56.1)#8 | 35.2%(+53.5)#343 |
| 9. | Cearfoss | 83.2% | 32.5%(+50.7)#9 | 35.2%(+48.0)#393 |
| 10. | Bladensburg | 81.0% | 32.5%(+48.5)#10 | 35.2%(+45.9)#424 |
| 11. | Langley Park | 77.2% | 32.5%(+44.6)#11 | 35.2%(+42.0)#504 |
| 12. | Silver Hill | 76.7% | 32.5%(+44.2)#12 | 35.2%(+41.5)#514 |
| 13. | Little Orleans | 76.0% | 32.5%(+43.5)#13 | 35.2%(+40.8)#524 |
| 14. | Mount Rainier | 74.5% | 32.5%(+42.0)#14 | 35.2%(+39.4)#560 |
| 15. | Salisbury | 74.2% | 32.5%(+41.7)#15 | 35.2%(+39.1)#569 |
| 16. | White Oak | 73.2% | 32.5%(+40.6)#16 | 35.2%(+38.0)#594 |
| 17. | Princess Anne | 69.8% | 32.5%(+37.3)#17 | 35.2%(+34.6)#718 |
| 18. | Glassmanor | 68.1% | 32.5%(+35.6)#18 | 35.2%(+33.0)#798 |
| 19. | Cockeysville | 64.6% | 32.5%(+32.1)#19 | 35.2%(+29.4)#982 |
| 20. | Suitland | 64.1% | 32.5%(+31.6)#20 | 35.2%(+28.9)#1,019 |
| 21. | Temple Hills | 63.8% | 32.5%(+31.3)#21 | 35.2%(+28.6)#1,037 |
| 22. | Silver Spring | 62.3% | 32.5%(+29.7)#22 | 35.2%(+27.1)#1,169 |
| 23. | Grantsville | 61.2% | 32.5%(+28.6)#23 | 35.2%(+26.0)#1,263 |
| 24. | Templeville | 61.1% | 32.5%(+28.6)#24 | 35.2%(+25.9)#1,269 |
| 25. | Mapleville | 60.1% | 32.5%(+27.6)#25 | 35.2%(+25.0)#1,352 |
| 26. | Friendship Heights Village | 60.1% | 32.5%(+27.5)#26 | 35.2%(+24.9)#1,358 |
| 27. | Henderson | 60.0% | 32.5%(+27.5)#27 | 35.2%(+24.8)#1,369 |
| 28. | Federalsburg | 59.9% | 32.5%(+27.4)#28 | 35.2%(+24.7)#1,388 |
| 29. | South Laurel | 59.9% | 32.5%(+27.3)#29 | 35.2%(+24.7)#1,390 |
| 30. | Hagerstown | 59.8% | 32.5%(+27.3)#30 | 35.2%(+24.6)#1,393 |
| 31. | Garrison | 59.5% | 32.5%(+27.0)#31 | 35.2%(+24.3)#1,423 |
| 32. | College Park | 59.1% | 32.5%(+26.6)#32 | 35.2%(+23.9)#1,468 |
| 33. | Williamsport | 58.8% | 32.5%(+26.3)#33 | 35.2%(+23.7)#1,497 |
| 34. | Chillum | 58.5% | 32.5%(+26.0)#34 | 35.2%(+23.3)#1,533 |
| 35. | Adelphi | 58.0% | 32.5%(+25.5)#35 | 35.2%(+22.8)#1,589 |
| 36. | Barrelville | 57.1% | 32.5%(+24.6)#36 | 35.2%(+22.0)#1,717 |
| 37. | Downsville | 56.4% | 32.5%(+23.8)#37 | 35.2%(+21.2)#1,816 |
| 38. | Brentwood | 56.0% | 32.5%(+23.5)#38 | 35.2%(+20.8)#1,869 |
| 39. | Cambridge | 55.8% | 32.5%(+23.3)#39 | 35.2%(+20.6)#1,891 |
| 40. | Laurel | 55.7% | 32.5%(+23.1)#40 | 35.2%(+20.5)#1,913 |
| 41. | Milford Mill | 55.4% | 32.5%(+22.9)#41 | 35.2%(+20.2)#1,964 |
| 42. | Marlow Heights | 55.1% | 32.5%(+22.6)#42 | 35.2%(+20.0)#2,010 |
| 43. | Summerfield | 55.1% | 32.5%(+22.6)#43 | 35.2%(+19.9)#2,015 |
| 44. | Lexington Park | 54.8% | 32.5%(+22.3)#44 | 35.2%(+19.6)#2,061 |
| 45. | Sudlersville | 54.8% | 32.5%(+22.3)#45 | 35.2%(+19.6)#2,064 |
| 46. | Nanticoke | 54.3% | 32.5%(+21.7)#46 | 35.2%(+19.1)#2,146 |
| 47. | Landover | 54.1% | 32.5%(+21.6)#47 | 35.2%(+19.0)#2,161 |
| 48. | Barclay | 53.9% | 32.5%(+21.4)#48 | 35.2%(+18.8)#2,188 |
| 49. | Fairland | 53.8% | 32.5%(+21.2)#49 | 35.2%(+18.6)#2,220 |
| 50. | Crisfield | 53.2% | 32.5%(+20.7)#50 | 35.2%(+18.0)#2,336 |
| 51. | Chestertown | 52.9% | 32.5%(+20.3)#51 | 35.2%(+17.7)#2,409 |
| 52. | Owings Mills | 52.3% | 32.5%(+19.7)#52 | 35.2%(+17.1)#2,535 |
| 53. | Baltimore | 52.2% | 32.5%(+19.7)#53 | 35.2%(+17.1)#2,540 |
| 54. | Elkton | 51.8% | 32.5%(+19.3)#54 | 35.2%(+16.6)#2,630 |
| 55. | New Carrollton | 51.8% | 32.5%(+19.2)#55 | 35.2%(+16.6)#2,635 |
| 56. | Eckhart Mines | 51.5% | 32.5%(+19.0)#56 | 35.2%(+16.4)#2,686 |
| 57. | Hillcrest Heights | 51.5% | 32.5%(+19.0)#57 | 35.2%(+16.3)#2,702 |
| 58. | National Harbor | 51.1% | 32.5%(+18.5)#58 | 35.2%(+15.9)#2,825 |
| 59. | North Bethesda | 50.8% | 32.5%(+18.3)#59 | 35.2%(+15.6)#2,901 |
| 60. | Clear Spring | 50.6% | 32.5%(+18.1)#60 | 35.2%(+15.4)#2,940 |
| 61. | Robinwood | 50.4% | 32.5%(+17.9)#61 | 35.2%(+15.2)#2,988 |
| 62. | Choptank | 50.0% | 32.5%(+17.5)#62 | 35.2%(+14.8)#3,115 |
| 63. | Rock Point | 50.0% | 32.5%(+17.5)#63 | 35.2%(+14.8)#3,117 |
| 64. | Prince Frederick | 49.8% | 32.5%(+17.3)#64 | 35.2%(+14.6)#3,177 |
| 65. | Hyattsville | 49.5% | 32.5%(+17.0)#65 | 35.2%(+14.3)#3,247 |
| 66. | Frostburg | 49.2% | 32.5%(+16.7)#66 | 35.2%(+14.0)#3,319 |
| 67. | Riverdale Park | 49.0% | 32.5%(+16.5)#67 | 35.2%(+13.8)#3,371 |
| 68. | Gaithersburg | 49.0% | 32.5%(+16.4)#68 | 35.2%(+13.8)#3,392 |
| 69. | Greenbelt | 48.7% | 32.5%(+16.1)#69 | 35.2%(+13.5)#3,480 |
| 70. | Takoma Park | 48.7% | 32.5%(+16.1)#70 | 35.2%(+13.5)#3,481 |
| 71. | Hancock | 48.3% | 32.5%(+15.8)#71 | 35.2%(+13.1)#3,584 |
| 72. | Cedar Heights | 47.8% | 32.5%(+15.3)#72 | 35.2%(+12.7)#3,728 |
| 73. | Greensboro | 47.8% | 32.5%(+15.2)#73 | 35.2%(+12.6)#3,753 |
| 74. | Jessup | 47.4% | 32.5%(+14.9)#74 | 35.2%(+12.3)#3,866 |
| 75. | Port Deposit | 47.4% | 32.5%(+14.8)#75 | 35.2%(+12.2)#3,888 |
| 76. | Oakland | 47.2% | 32.5%(+14.7)#76 | 35.2%(+12.0)#3,933 |
| 77. | Delmar | 47.1% | 32.5%(+14.5)#77 | 35.2%(+11.9)#4,007 |
| 78. | Rossville | 46.8% | 32.5%(+14.3)#78 | 35.2%(+11.6)#4,088 |
| 79. | Danville | 46.7% | 32.5%(+14.2)#79 | 35.2%(+11.5)#4,110 |
| 80. | East Riverdale | 46.6% | 32.5%(+14.1)#80 | 35.2%(+11.4)#4,155 |
| 81. | Leonardtown | 46.3% | 32.5%(+13.8)#81 | 35.2%(+11.1)#4,229 |
| 82. | Westminster | 46.2% | 32.5%(+13.7)#82 | 35.2%(+11.0)#4,254 |
| 83. | North Beach | 46.2% | 32.5%(+13.7)#83 | 35.2%(+11.0)#4,261 |
| 84. | Garretts Mill | 45.8% | 32.5%(+13.2)#84 | 35.2%(+10.6)#4,419 |
| 85. | Buckeystown | 45.5% | 32.5%(+13.0)#85 | 35.2%(+10.3)#4,501 |
| 86. | Rockville | 45.4% | 32.5%(+12.9)#86 | 35.2%(+10.2)#4,535 |
| 87. | Walker Mill | 45.1% | 32.5%(+12.5)#87 | 35.2%(+9.89)#4,661 |
| 88. | Bowling Green | 45.0% | 32.5%(+12.5)#88 | 35.2%(+9.82)#4,685 |
| 89. | Breathedsville | 44.4% | 32.5%(+11.9)#89 | 35.2%(+9.26)#4,889 |
| 90. | Baltimore Highlands | 44.0% | 32.5%(+11.5)#90 | 35.2%(+8.82)#5,050 |
| 91. | Berlin | 43.8% | 32.5%(+11.3)#91 | 35.2%(+8.64)#5,118 |
| 92. | Bishopville | 43.7% | 32.5%(+11.1)#92 | 35.2%(+8.49)#5,190 |
| 93. | Rising Sun | 43.6% | 32.5%(+11.1)#93 | 35.2%(+8.43)#5,222 |
| 94. | Perryman | 43.2% | 32.5%(+10.7)#94 | 35.2%(+8.04)#5,373 |
| 95. | Beltsville | 42.7% | 32.5%(+10.2)#95 | 35.2%(+7.50)#5,595 |
| 96. | Towson | 42.5% | 32.5%(+9.98)#96 | 35.2%(+7.32)#5,668 |
| 97. | Edmonston | 42.3% | 32.5%(+9.79)#97 | 35.2%(+7.13)#5,748 |
| 98. | Sandy Hook | 42.3% | 32.5%(+9.74)#98 | 35.2%(+7.08)#5,770 |
| 99. | North East | 42.2% | 32.5%(+9.70)#99 | 35.2%(+7.04)#5,793 |
| 100. | Kensington | 42.2% | 32.5%(+9.66)#100 | 35.2%(+7.01)#5,803 |
Common Questions
What are the Top 10 Cities with the Highest Percentage of Renter-Occupied Units in Maryland?
Top 10 Cities with the Highest Percentage of Renter-Occupied Units in Maryland are:
#1
100.0%
#2
100.0%
#3
100.0%
#4
99.8%
#5
99.0%
#6
98.7%
#7
91.6%
#8
88.6%
#9
83.2%
#10
81.0%
What city has the Highest Percentage of Renter-Occupied Units in Maryland?
Naval Academy has the Highest Percentage of Renter-Occupied Units in Maryland with 100.0%.
What is the Percentage of Renter-Occupied Units in the State of Maryland?
Percentage of Renter-Occupied Units in Maryland is 32.5%.
What is the Percentage of Renter-Occupied Units in the United States?
Percentage of Renter-Occupied Units in the United States is 35.2%.