Cities with the Highest Percentage of Households Heated by Bottled Gas / Liquid Propane in Maryland
RELATED REPORTS & OPTIONS
Bottled Gas / LP Heating
Maryland
Compare Cities
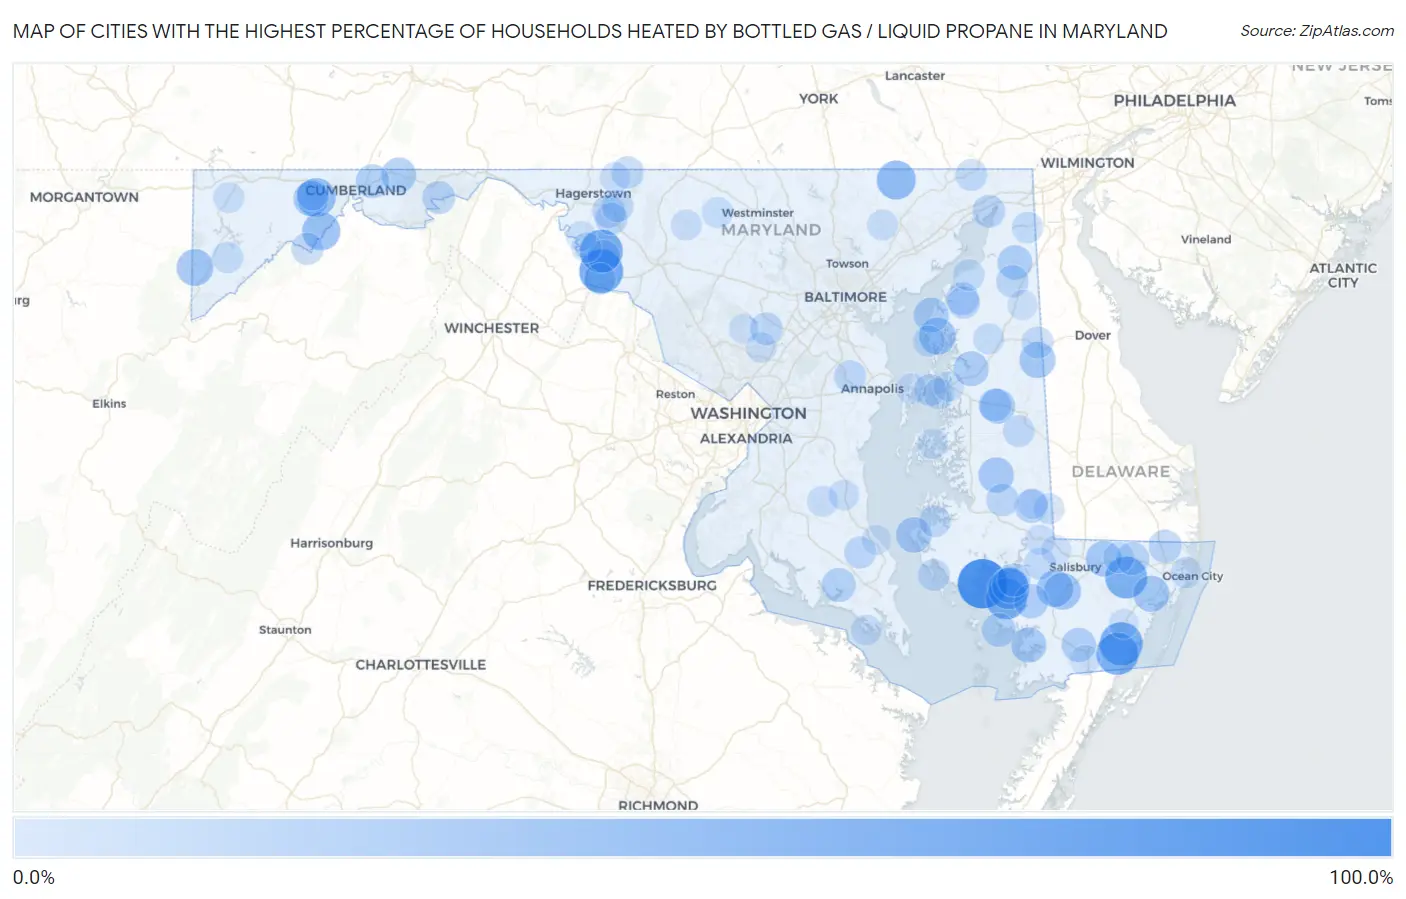
Map of Cities with the Highest Percentage of Households Heated by Bottled Gas / Liquid Propane in Maryland
0.0%
100.0%
Cities with the Highest Percentage of Households Heated by Bottled Gas / Liquid Propane in Maryland
| City | Bottled Gas / LP Heating | vs State | vs National | |
| 1. | Elliott | 100.0% | 3.7%(+96.3)#1 | 4.9%(+95.1)#188 |
| 2. | Lisbon | 75.0% | 3.7%(+71.3)#2 | 4.9%(+70.1)#877 |
| 3. | Yarrowsburg | 72.7% | 3.7%(+69.0)#3 | 4.9%(+67.8)#986 |
| 4. | Mount Briar | 69.7% | 3.7%(+66.0)#4 | 4.9%(+64.8)#1,132 |
| 5. | Girdletree | 69.6% | 3.7%(+65.9)#5 | 4.9%(+64.7)#1,139 |
| 6. | Stockton | 66.0% | 3.7%(+62.3)#6 | 4.9%(+61.1)#1,347 |
| 7. | Powellville | 64.5% | 3.7%(+60.8)#7 | 4.9%(+59.6)#1,425 |
| 8. | Nanticoke Acres | 60.9% | 3.7%(+57.2)#8 | 4.9%(+56.0)#1,634 |
| 9. | Jesterville | 60.6% | 3.7%(+56.9)#9 | 4.9%(+55.7)#1,649 |
| 10. | Shaft | 51.1% | 3.7%(+47.4)#10 | 4.9%(+46.2)#2,325 |
| 11. | Pylesville | 50.5% | 3.7%(+46.8)#11 | 4.9%(+45.6)#2,357 |
| 12. | Crumpton | 49.4% | 3.7%(+45.7)#12 | 4.9%(+44.5)#2,464 |
| 13. | Danville | 46.7% | 3.7%(+43.0)#13 | 4.9%(+41.8)#2,673 |
| 14. | Edesville | 41.2% | 3.7%(+37.5)#14 | 4.9%(+36.3)#3,131 |
| 15. | Eden | 40.9% | 3.7%(+37.2)#15 | 4.9%(+36.0)#3,152 |
| 16. | Allen | 40.7% | 3.7%(+37.0)#16 | 4.9%(+35.8)#3,174 |
| 17. | Crellin | 40.3% | 3.7%(+36.6)#17 | 4.9%(+35.4)#3,208 |
| 18. | Newark | 37.8% | 3.7%(+34.1)#18 | 4.9%(+32.9)#3,437 |
| 19. | Henderson | 37.5% | 3.7%(+33.8)#19 | 4.9%(+32.6)#3,465 |
| 20. | Bivalve | 36.5% | 3.7%(+32.8)#20 | 4.9%(+31.6)#3,555 |
| 21. | Still Pond | 36.4% | 3.7%(+32.7)#21 | 4.9%(+31.5)#3,563 |
| 22. | Parsonsburg | 35.9% | 3.7%(+32.2)#22 | 4.9%(+31.0)#3,597 |
| 23. | Taylors Island | 34.5% | 3.7%(+30.8)#23 | 4.9%(+29.6)#3,732 |
| 24. | Choptank | 34.5% | 3.7%(+30.8)#24 | 4.9%(+29.6)#3,733 |
| 25. | Carlos | 34.3% | 3.7%(+30.6)#25 | 4.9%(+29.4)#3,756 |
| 26. | Fairmount | 33.3% | 3.7%(+29.6)#26 | 4.9%(+28.4)#3,825 |
| 27. | Hillsboro | 32.8% | 3.7%(+29.1)#27 | 4.9%(+27.9)#3,915 |
| 28. | Tolchester | 32.6% | 3.7%(+28.9)#28 | 4.9%(+27.7)#3,931 |
| 29. | Centreville | 32.2% | 3.7%(+28.5)#29 | 4.9%(+27.3)#3,975 |
| 30. | Flintstone | 31.8% | 3.7%(+28.1)#30 | 4.9%(+26.9)#4,026 |
| 31. | Cecilton | 30.6% | 3.7%(+26.9)#31 | 4.9%(+25.7)#4,150 |
| 32. | West Pocomoke | 29.7% | 3.7%(+26.0)#32 | 4.9%(+24.8)#4,260 |
| 33. | Mount Vernon | 29.2% | 3.7%(+25.5)#33 | 4.9%(+24.3)#4,323 |
| 34. | Leonardtown | 28.0% | 3.7%(+24.3)#34 | 4.9%(+23.1)#4,473 |
| 35. | Deal Island | 27.8% | 3.7%(+24.1)#35 | 4.9%(+22.9)#4,500 |
| 36. | Pleasant Grove | 27.1% | 3.7%(+23.4)#36 | 4.9%(+22.2)#4,598 |
| 37. | Ten Mile Creek | 25.8% | 3.7%(+22.1)#37 | 4.9%(+20.9)#4,776 |
| 38. | Tyaskin | 25.0% | 3.7%(+21.3)#38 | 4.9%(+20.1)#4,906 |
| 39. | Brookview | 25.0% | 3.7%(+21.3)#39 | 4.9%(+20.1)#4,922 |
| 40. | Bishopville | 24.7% | 3.7%(+21.0)#40 | 4.9%(+19.8)#4,956 |
| 41. | Willards | 24.3% | 3.7%(+20.6)#41 | 4.9%(+19.4)#5,005 |
| 42. | Little Orleans | 24.0% | 3.7%(+20.3)#42 | 4.9%(+19.1)#5,062 |
| 43. | Queen Anne | 23.3% | 3.7%(+19.6)#43 | 4.9%(+18.4)#5,155 |
| 44. | Butlertown | 22.8% | 3.7%(+19.1)#44 | 4.9%(+17.9)#5,230 |
| 45. | Charlestown | 22.5% | 3.7%(+18.8)#45 | 4.9%(+17.6)#5,263 |
| 46. | Beaver Creek | 22.5% | 3.7%(+18.8)#46 | 4.9%(+17.6)#5,275 |
| 47. | Trego Rohrersville Station | 22.5% | 3.7%(+18.8)#47 | 4.9%(+17.6)#5,278 |
| 48. | Cedar Heights | 22.3% | 3.7%(+18.6)#48 | 4.9%(+17.4)#5,301 |
| 49. | Highland | 22.0% | 3.7%(+18.3)#49 | 4.9%(+17.1)#5,347 |
| 50. | East New Market | 21.5% | 3.7%(+17.8)#50 | 4.9%(+16.6)#5,437 |
| 51. | Galena | 21.3% | 3.7%(+17.6)#51 | 4.9%(+16.4)#5,461 |
| 52. | San Mar | 21.2% | 3.7%(+17.5)#52 | 4.9%(+16.3)#5,480 |
| 53. | Worton | 20.9% | 3.7%(+17.2)#53 | 4.9%(+16.0)#5,531 |
| 54. | Kent Narrows | 20.2% | 3.7%(+16.5)#54 | 4.9%(+15.3)#5,646 |
| 55. | Ringgold | 20.0% | 3.7%(+16.3)#55 | 4.9%(+15.1)#5,699 |
| 56. | Mccoole | 19.9% | 3.7%(+16.2)#56 | 4.9%(+15.0)#5,727 |
| 57. | Broomes Island | 19.8% | 3.7%(+16.1)#57 | 4.9%(+14.9)#5,740 |
| 58. | Crownsville | 19.7% | 3.7%(+16.0)#58 | 4.9%(+14.8)#5,753 |
| 59. | Templeville | 19.4% | 3.7%(+15.7)#59 | 4.9%(+14.5)#5,801 |
| 60. | Quantico | 19.3% | 3.7%(+15.6)#60 | 4.9%(+14.4)#5,817 |
| 61. | Mount Aetna | 18.8% | 3.7%(+15.1)#61 | 4.9%(+13.9)#5,899 |
| 62. | Madison | 18.7% | 3.7%(+15.0)#62 | 4.9%(+13.8)#5,933 |
| 63. | Fishing Creek | 18.5% | 3.7%(+14.8)#63 | 4.9%(+13.6)#5,961 |
| 64. | Rising Sun | 18.3% | 3.7%(+14.6)#64 | 4.9%(+13.4)#5,991 |
| 65. | Williston | 18.3% | 3.7%(+14.6)#65 | 4.9%(+13.4)#6,011 |
| 66. | Betterton | 17.8% | 3.7%(+14.1)#66 | 4.9%(+12.9)#6,127 |
| 67. | Chesapeake City | 16.7% | 3.7%(+13.0)#67 | 4.9%(+11.8)#6,365 |
| 68. | Deer Park | 16.6% | 3.7%(+12.9)#68 | 4.9%(+11.7)#6,412 |
| 69. | Rock Hall | 16.5% | 3.7%(+12.8)#69 | 4.9%(+11.6)#6,419 |
| 70. | Garretts Mill | 16.4% | 3.7%(+12.7)#70 | 4.9%(+11.5)#6,451 |
| 71. | Graceham | 16.0% | 3.7%(+12.3)#71 | 4.9%(+11.1)#6,541 |
| 72. | Pittsville | 15.4% | 3.7%(+11.7)#72 | 4.9%(+10.5)#6,667 |
| 73. | Union Bridge | 15.4% | 3.7%(+11.7)#73 | 4.9%(+10.5)#6,675 |
| 74. | Grasonville | 15.2% | 3.7%(+11.5)#74 | 4.9%(+10.3)#6,722 |
| 75. | Church Hill | 15.1% | 3.7%(+11.4)#75 | 4.9%(+10.2)#6,752 |
| 76. | Midlothian | 15.1% | 3.7%(+11.4)#76 | 4.9%(+10.2)#6,760 |
| 77. | West Ocean City | 14.9% | 3.7%(+11.2)#77 | 4.9%(+10.00)#6,793 |
| 78. | Accident | 14.9% | 3.7%(+11.2)#78 | 4.9%(+10.00)#6,811 |
| 79. | Aquasco | 14.7% | 3.7%(+11.0)#79 | 4.9%(+9.80)#6,855 |
| 80. | Galestown | 14.7% | 3.7%(+11.0)#80 | 4.9%(+9.80)#6,859 |
| 81. | Woodsboro | 14.5% | 3.7%(+10.8)#81 | 4.9%(+9.60)#6,887 |
| 82. | Fallston | 14.1% | 3.7%(+10.4)#82 | 4.9%(+9.20)#6,982 |
| 83. | Leitersburg | 14.1% | 3.7%(+10.4)#83 | 4.9%(+9.20)#6,999 |
| 84. | Piney Point | 13.9% | 3.7%(+10.2)#84 | 4.9%(+9.00)#7,033 |
| 85. | Huntingtown | 13.6% | 3.7%(+9.90)#85 | 4.9%(+8.70)#7,100 |
| 86. | Queenstown | 13.6% | 3.7%(+9.90)#86 | 4.9%(+8.70)#7,108 |
| 87. | Spencerville | 13.5% | 3.7%(+9.80)#87 | 4.9%(+8.60)#7,132 |
| 88. | Stevensville | 13.1% | 3.7%(+9.40)#88 | 4.9%(+8.20)#7,241 |
| 89. | Eldorado | 12.5% | 3.7%(+8.80)#89 | 4.9%(+7.60)#7,446 |
| 90. | St Michaels | 12.4% | 3.7%(+8.70)#90 | 4.9%(+7.50)#7,462 |
| 91. | Mardela Springs | 12.4% | 3.7%(+8.70)#91 | 4.9%(+7.50)#7,477 |
| 92. | Mercersville | 12.1% | 3.7%(+8.40)#92 | 4.9%(+7.20)#7,582 |
| 93. | Sharpsburg | 11.8% | 3.7%(+8.10)#93 | 4.9%(+6.90)#7,672 |
| 94. | Lewistown | 11.7% | 3.7%(+8.00)#94 | 4.9%(+6.80)#7,721 |
| 95. | Hebron | 11.5% | 3.7%(+7.80)#95 | 4.9%(+6.60)#7,770 |
| 96. | Pocomoke City | 11.4% | 3.7%(+7.70)#96 | 4.9%(+6.50)#7,795 |
| 97. | Snow Hill | 11.4% | 3.7%(+7.70)#97 | 4.9%(+6.50)#7,801 |
| 98. | Long Beach | 11.4% | 3.7%(+7.70)#98 | 4.9%(+6.50)#7,805 |
| 99. | Millington | 11.4% | 3.7%(+7.70)#99 | 4.9%(+6.50)#7,811 |
| 100. | Brookeville | 11.3% | 3.7%(+7.60)#100 | 4.9%(+6.40)#7,855 |
Common Questions
What are the Top 10 Cities with the Highest Percentage of Households Heated by Bottled Gas / Liquid Propane in Maryland?
Top 10 Cities with the Highest Percentage of Households Heated by Bottled Gas / Liquid Propane in Maryland are:
#1
100.0%
#2
72.7%
#3
69.7%
#4
69.6%
#5
66.0%
#6
64.5%
#7
60.9%
#8
60.6%
#9
51.1%
#10
50.5%
What city has the Highest Percentage of Households Heated by Bottled Gas / Liquid Propane in Maryland?
Elliott has the Highest Percentage of Households Heated by Bottled Gas / Liquid Propane in Maryland with 100.0%.
What is the Percentage of Households Heated by Bottled Gas / Liquid Propane in the State of Maryland?
Percentage of Households Heated by Bottled Gas / Liquid Propane in Maryland is 3.7%.
What is the Percentage of Households Heated by Bottled Gas / Liquid Propane in the United States?
Percentage of Households Heated by Bottled Gas / Liquid Propane in the United States is 4.9%.