Zip Codes with the Highest Percentage of Population Employed in Arts, Entertainment & Recreation in Bethesda, MD

RELATED REPORTS & OPTIONS

Arts, Entertainment & Recreation
Population
Families and Households
Female Fertility
Female Fertility (Unmarried)
Race (Community Size)
Race (Percentage)
Ancestry (Community Size)
AfricanAlbanianAmericanArabArgentineanArmenianAustralianAustrianBasqueBelgianBhutaneseBolivianBrazilianBritishBulgarianBurmeseCanadianCentral AmericanCherokeeChileanColombianCroatianCubanCzechDanishDominicanDutchEastern EuropeanEcuadorianEgyptianEnglishEstonianEthiopianEuropeanFilipinoFinnishFrenchFrench CanadianGermanGhanaianGreekGuamanian / ChamorroGuatemalanGuyaneseHaitianHonduranHungarianIcelanderIndian (Asian)IranianIraqiIrishIsraeliItalianJamaicanKenyanKoreanLaotianLatvianLebaneseLithuanianMexicanMexican American IndianMongolianMoroccanNative HawaiianNicaraguanNigerianNorthern EuropeanNorwegianPakistaniPanamanianParaguayanPeruvianPolishPortuguesePuerto RicanRomanianRussianSalvadoranScandinavianScotch-IrishScottishSenegaleseSerbianSlavicSlovakSloveneSouth AfricanSouth AmericanSpaniardSpanishSri LankanSubsaharan AfricanSwedishSwissSyrianThaiTurkishUkrainianUruguayanVenezuelanVietnameseWelshWest Indian
Ancestry (Percentage)
AfricanAlbanianAmericanArabArgentineanArmenianAustralianAustrianBasqueBelgianBhutaneseBolivianBrazilianBritishBulgarianBurmeseCanadianCentral AmericanCherokeeChileanColombianCroatianCubanCzechDanishDominicanDutchEastern EuropeanEcuadorianEgyptianEnglishEstonianEthiopianEuropeanFilipinoFinnishFrenchFrench CanadianGermanGhanaianGreekGuamanian / ChamorroGuatemalanGuyaneseHaitianHonduranHungarianIcelanderIndian (Asian)IranianIraqiIrishIsraeliItalianJamaicanKenyanKoreanLaotianLatvianLebaneseLithuanianMexicanMexican American IndianMongolianMoroccanNative HawaiianNicaraguanNigerianNorthern EuropeanNorwegianPakistaniPanamanianParaguayanPeruvianPolishPortuguesePuerto RicanRomanianRussianSalvadoranScandinavianScotch-IrishScottishSenegaleseSerbianSlavicSlovakSloveneSouth AfricanSouth AmericanSpaniardSpanishSri LankanSubsaharan AfricanSwedishSwissSyrianThaiTurkishUkrainianUruguayanVenezuelanVietnameseWelshWest Indian
Immigrant Origin (Total)
AfghanistanAfricaAlbaniaArgentinaArmeniaAsiaAustraliaAustriaBangladeshBelarusBelgiumBoliviaBrazilBulgariaCanadaCaribbeanCentral AmericaChileChinaColombiaCubaCzechoslovakiaDenmarkDominican RepublicEastern AfricaEastern AsiaEastern EuropeEcuadorEgyptEl SalvadorEnglandEthiopiaEuropeFranceGermanyGhanaGreeceGuatemalaGuyanaHong KongHungaryIndiaIndonesiaIranIraqIsraelItalyJamaicaJapanKazakhstanKenyaKoreaKuwaitLaosLatin AmericaLatviaLebanonMalaysiaMexicoMiddle AfricaMoroccoNetherlandsNicaraguaNorthern AfricaNorthern EuropeNorwayOceaniaPakistanPanamaPeruPhilippinesPolandPortugalRomaniaRussiaSaudi ArabiaScotlandSenegalSerbiaSouth AfricaSouth AmericaSouth Central AsiaSouth Eastern AsiaSouthern EuropeSpainSri LankaSwedenSwitzerlandTaiwanThailandTurkeyUkraineUruguayVenezuelaVietnamWestern AfricaWestern AsiaWestern EuropeZaireZimbabwe
Immigrant Origin (Percentage)
AfghanistanAfricaAlbaniaArgentinaArmeniaAsiaAustraliaAustriaBangladeshBelarusBelgiumBoliviaBrazilBulgariaCanadaCaribbeanCentral AmericaChileChinaColombiaCubaCzechoslovakiaDenmarkDominican RepublicEastern AfricaEastern AsiaEastern EuropeEcuadorEgyptEl SalvadorEnglandEthiopiaEuropeFranceGermanyGhanaGreeceGuatemalaGuyanaHong KongHungaryIndiaIndonesiaIranIraqIsraelItalyJamaicaJapanKazakhstanKenyaKoreaKuwaitLaosLatin AmericaLatviaLebanonMalaysiaMexicoMiddle AfricaMoroccoNetherlandsNicaraguaNorthern AfricaNorthern EuropeNorwayOceaniaPakistanPanamaPeruPhilippinesPolandPortugalRomaniaRussiaSaudi ArabiaScotlandSenegalSerbiaSouth AfricaSouth AmericaSouth Central AsiaSouth Eastern AsiaSouthern EuropeSpainSri LankaSwedenSwitzerlandTaiwanThailandTurkeyUkraineUruguayVenezuelaVietnamWestern AfricaWestern AsiaWestern EuropeZaireZimbabwe
Income
Income (Families)
Income (Households)
Poverty
Poverty (Families)
Unemployment
Employment Occupations
Employment Industries
Employer Class
Commute Time
Commute Means
School Enrollment
Education by Degree Field
Occupancy
Finances
Physical Characteristics
Bethesda
Compare Zip Codes
Comparison Subject

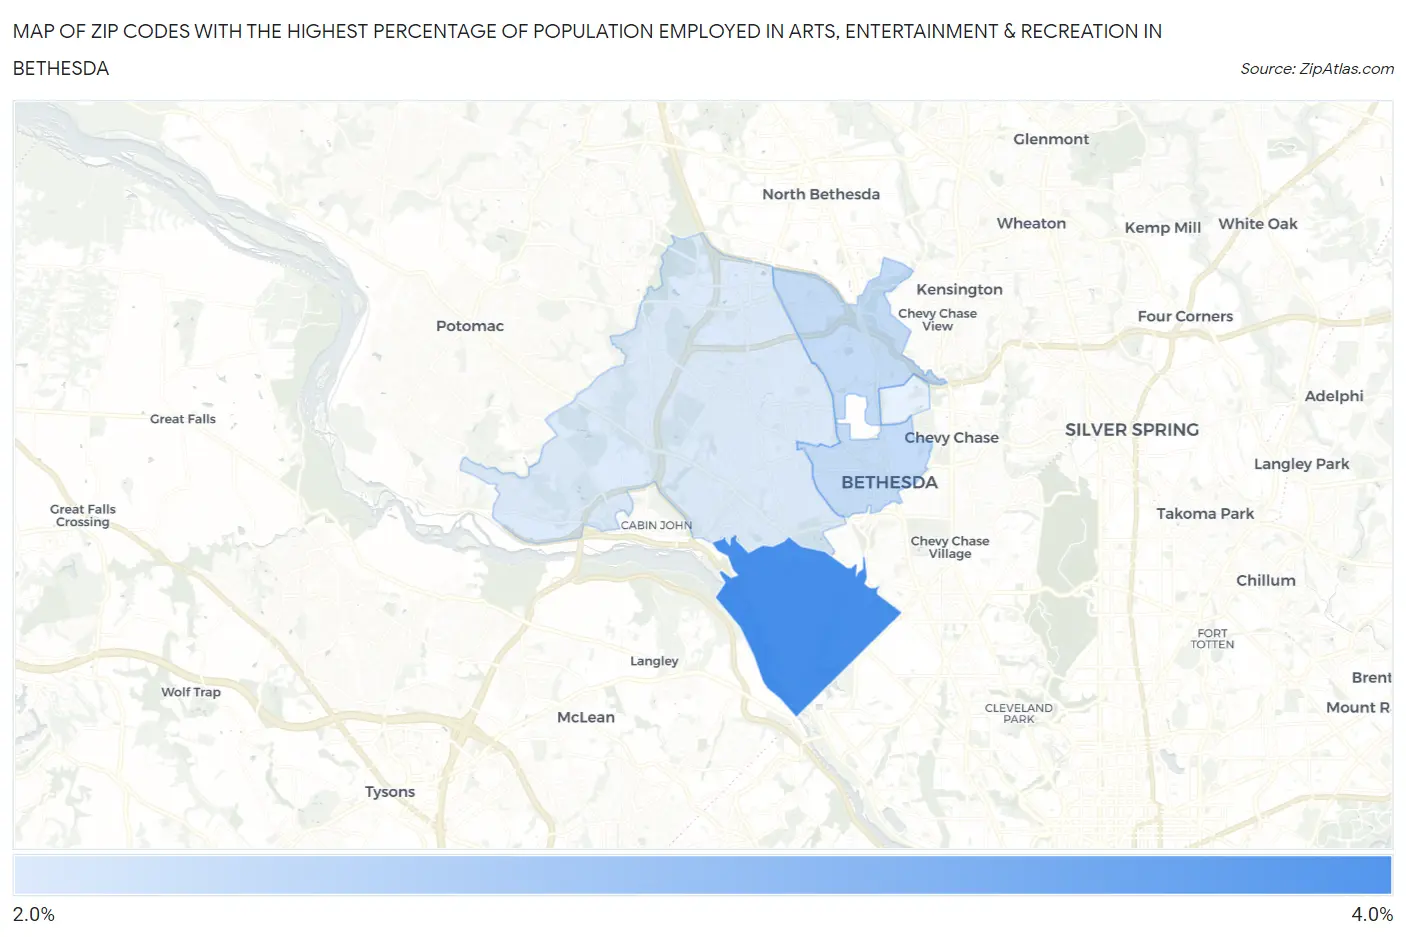
Map of Zip Codes with the Highest Percentage of Population Employed in Arts, Entertainment & Recreation in Bethesda

0.0%
4.0%
Zip Codes with the Highest Percentage of Population Employed in Arts, Entertainment & Recreation in Bethesda Map

Zip Codes with the Highest Percentage of Population Employed in Arts, Entertainment & Recreation in Bethesda, MD

Zip Code % Employed vs State vs National
1.208163.9%1.9%(+1.99)#462.1%(+1.82)#3,476
2.208142.5%1.9%(+0.555)#1102.1%(+0.383)#7,325
3.208172.2%1.9%(+0.310)#1422.1%(+0.139)#8,511

Common Questions

What are the Top 3 Zip Codes with the Highest Percentage of Population Employed in Arts, Entertainment & Recreation in Bethesda, MD?
Top 3 Zip Codes with the Highest Percentage of Population Employed in Arts, Entertainment & Recreation in Bethesda, MD are:
#1
3.9%
#2
2.5%
#3
2.2%
What zip code has the Highest Percentage of Population Employed in Arts, Entertainment & Recreation in Bethesda, MD?
20816 has the Highest Percentage of Population Employed in Arts, Entertainment & Recreation in Bethesda, MD with 3.9%.
What is the Percentage of Population Employed in Arts, Entertainment & Recreation in Bethesda, MD?
Percentage of Population Employed in Arts, Entertainment & Recreation in Bethesda is 2.0%.
What is the Percentage of Population Employed in Arts, Entertainment & Recreation in Maryland?
Percentage of Population Employed in Arts, Entertainment & Recreation in Maryland is 1.9%.
What is the Percentage of Population Employed in Arts, Entertainment & Recreation in the United States?
Percentage of Population Employed in Arts, Entertainment & Recreation in the United States is 2.1%.