Zip Codes with the Highest Percentage of Population Employed in Arts, Entertainment & Recreation in Bel Air, MD
RELATED REPORTS & OPTIONS
Arts, Entertainment & Recreation
Bel Air
Compare Zip Codes
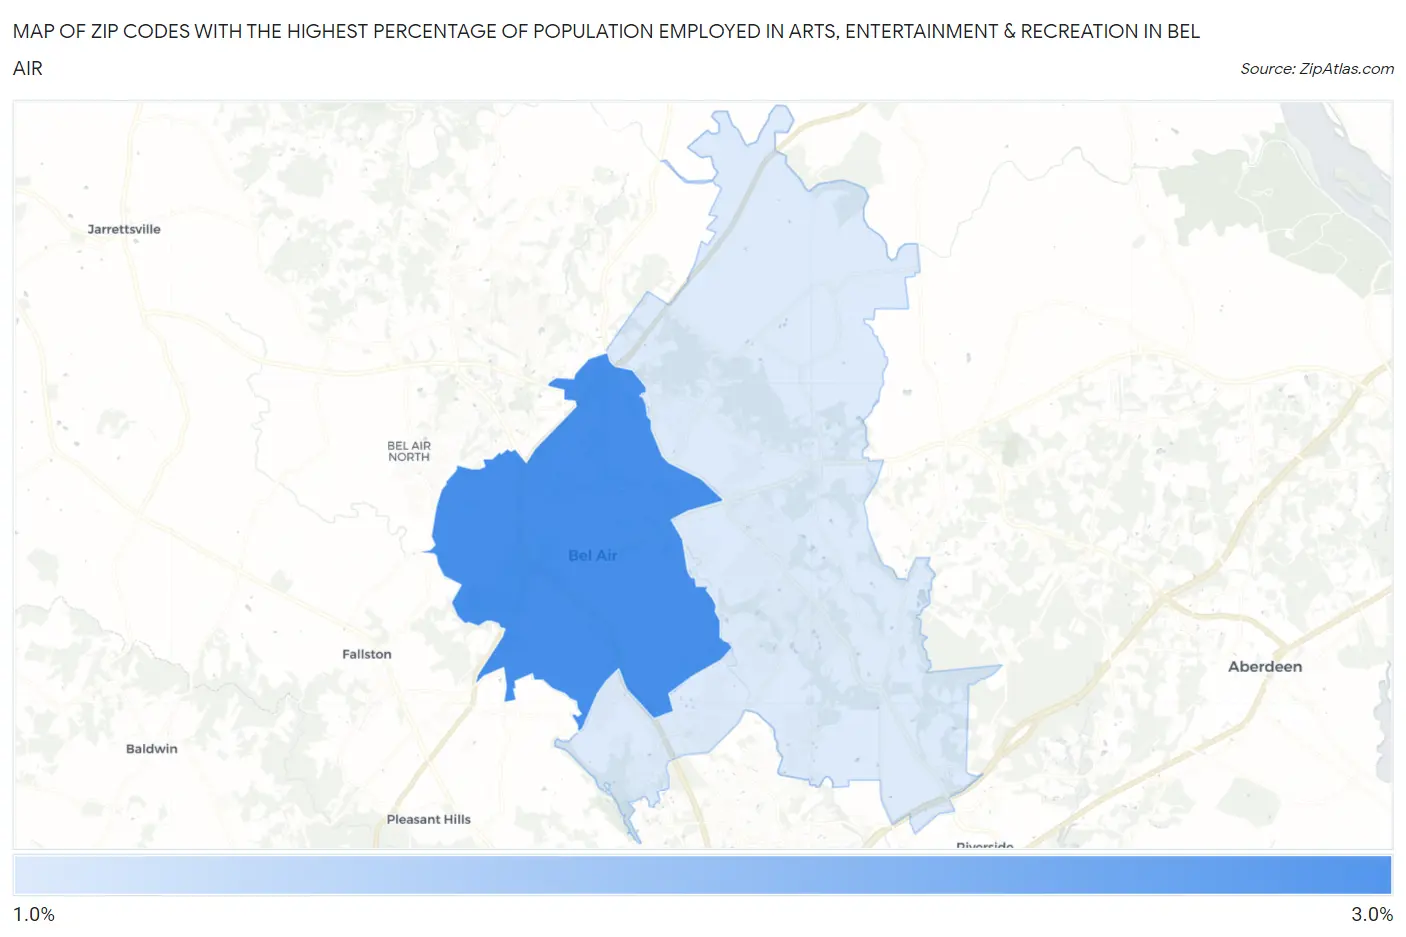
Map of Zip Codes with the Highest Percentage of Population Employed in Arts, Entertainment & Recreation in Bel Air
0.0%
3.0%
Zip Codes with the Highest Percentage of Population Employed in Arts, Entertainment & Recreation in Bel Air, MD
| Zip Code | % Employed | vs State | vs National | |
| 1. | 21014 | 2.6% | 1.9%(+0.684)#97 | 2.1%(+0.513)#6,778 |
| 2. | 21015 | 1.5% | 1.9%(-0.404)#240 | 2.1%(-0.576)#13,196 |
1
Common Questions
What are the Top Zip Codes with the Highest Percentage of Population Employed in Arts, Entertainment & Recreation in Bel Air, MD?
Top Zip Codes with the Highest Percentage of Population Employed in Arts, Entertainment & Recreation in Bel Air, MD are:
What zip code has the Highest Percentage of Population Employed in Arts, Entertainment & Recreation in Bel Air, MD?
21014 has the Highest Percentage of Population Employed in Arts, Entertainment & Recreation in Bel Air, MD with 2.6%.
What is the Percentage of Population Employed in Arts, Entertainment & Recreation in Bel Air, MD?
Percentage of Population Employed in Arts, Entertainment & Recreation in Bel Air is 2.7%.
What is the Percentage of Population Employed in Arts, Entertainment & Recreation in Maryland?
Percentage of Population Employed in Arts, Entertainment & Recreation in Maryland is 1.9%.
What is the Percentage of Population Employed in Arts, Entertainment & Recreation in the United States?
Percentage of Population Employed in Arts, Entertainment & Recreation in the United States is 2.1%.