Zip Codes with the Highest Percentage of Population Taking Public Transit to Work in Baltimore, MD
RELATED REPORTS & OPTIONS
Public Transit
Baltimore
Compare Zip Codes
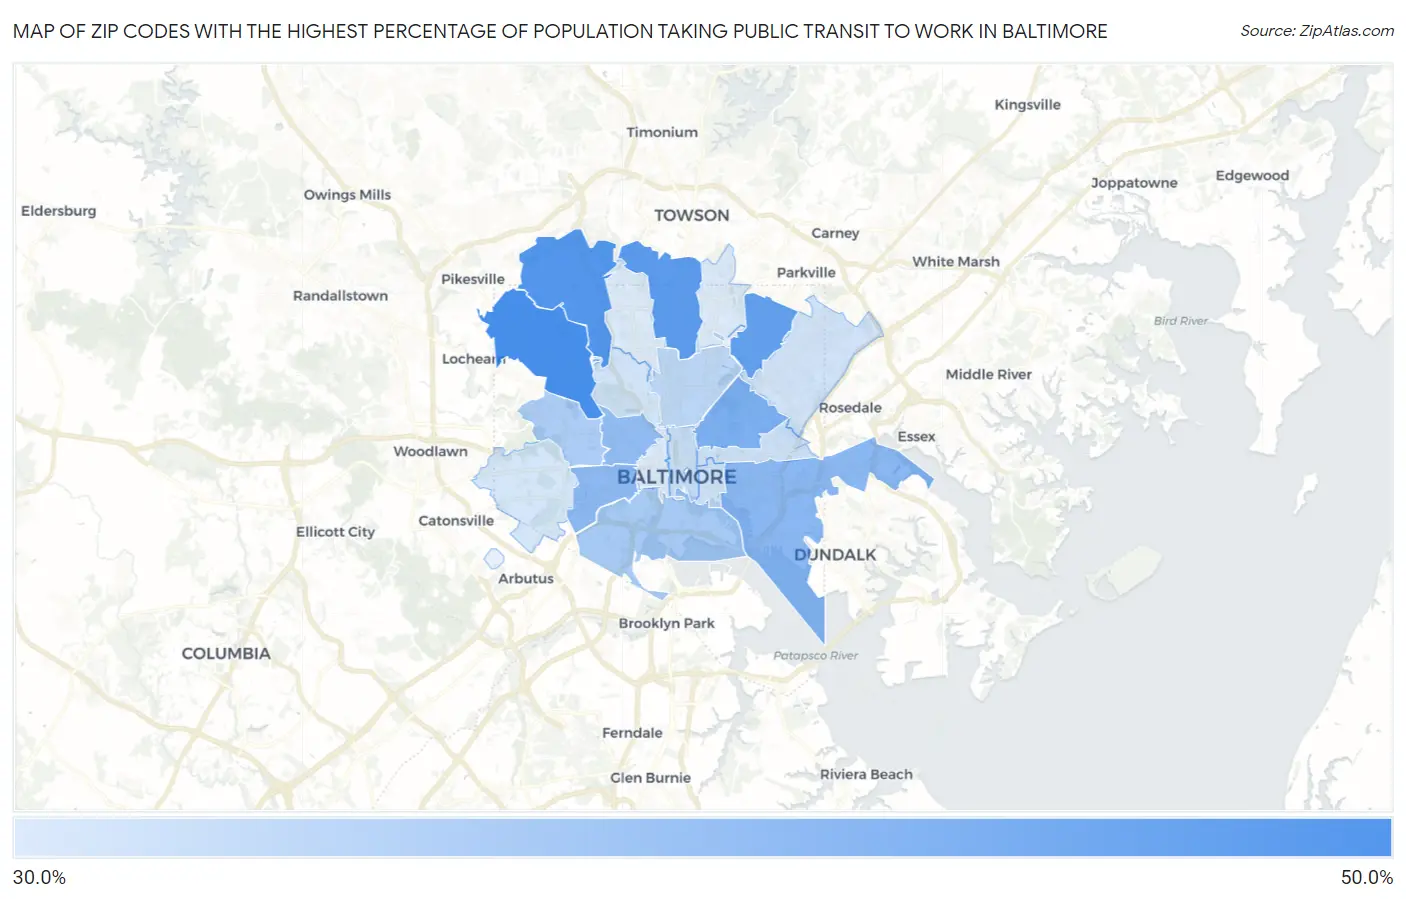
Map of Zip Codes with the Highest Percentage of Population Taking Public Transit to Work in Baltimore
32.4%
47.0%
Zip Codes with the Highest Percentage of Population Taking Public Transit to Work in Baltimore, MD
| Zip Code | % Public Transit | vs State | vs National | |
| 1. | 21215 | 47.0% | 40.9%(+6.10)#67 | 38.5%(+8.50)#2,192 |
| 2. | 21209 | 45.6% | 40.9%(+4.70)#83 | 38.5%(+7.10)#2,553 |
| 3. | 21212 | 45.1% | 40.9%(+4.20)#87 | 38.5%(+6.60)#2,699 |
| 4. | 21214 | 44.1% | 40.9%(+3.20)#97 | 38.5%(+5.60)#2,978 |
| 5. | 21213 | 41.7% | 40.9%(+0.800)#120 | 38.5%(+3.20)#3,634 |
| 6. | 21224 | 40.3% | 40.9%(-0.600)#138 | 38.5%(+1.80)#4,086 |
| 7. | 21223 | 40.1% | 40.9%(-0.800)#146 | 38.5%(+1.60)#4,190 |
| 8. | 21217 | 39.7% | 40.9%(-1.20)#151 | 38.5%(+1.20)#4,293 |
| 9. | 21230 | 37.5% | 40.9%(-3.40)#169 | 38.5%(-1.00)#4,970 |
| 10. | 21216 | 37.0% | 40.9%(-3.90)#172 | 38.5%(-1.50)#5,106 |
| 11. | 21218 | 35.4% | 40.9%(-5.50)#185 | 38.5%(-3.10)#5,575 |
| 12. | 21202 | 34.5% | 40.9%(-6.40)#188 | 38.5%(-4.00)#5,829 |
| 13. | 21205 | 33.9% | 40.9%(-7.00)#193 | 38.5%(-4.60)#5,991 |
| 14. | 21231 | 33.8% | 40.9%(-7.10)#194 | 38.5%(-4.70)#6,021 |
| 15. | 21206 | 33.4% | 40.9%(-7.50)#195 | 38.5%(-5.10)#6,108 |
| 16. | 21211 | 33.3% | 40.9%(-7.60)#196 | 38.5%(-5.20)#6,153 |
| 17. | 21229 | 33.1% | 40.9%(-7.80)#197 | 38.5%(-5.40)#6,195 |
| 18. | 21201 | 32.7% | 40.9%(-8.20)#201 | 38.5%(-5.80)#6,290 |
| 19. | 21239 | 32.4% | 40.9%(-8.50)#202 | 38.5%(-6.10)#6,365 |
| 20. | 21210 | 32.4% | 40.9%(-8.50)#203 | 38.5%(-6.10)#6,370 |
1
Common Questions
What are the Top 10 Zip Codes with the Highest Percentage of Population Taking Public Transit to Work in Baltimore, MD?
Top 10 Zip Codes with the Highest Percentage of Population Taking Public Transit to Work in Baltimore, MD are:
What zip code has the Highest Percentage of Population Taking Public Transit to Work in Baltimore, MD?
21215 has the Highest Percentage of Population Taking Public Transit to Work in Baltimore, MD with 47.0%.
What is the Percentage of Population Taking Public Transit to Work in Baltimore, MD?
Percentage of Population Taking Public Transit to Work in Baltimore is 36.8%.
What is the Percentage of Population Taking Public Transit to Work in Maryland?
Percentage of Population Taking Public Transit to Work in Maryland is 40.9%.
What is the Percentage of Population Taking Public Transit to Work in the United States?
Percentage of Population Taking Public Transit to Work in the United States is 38.5%.