Zip Codes with the Highest Percentage of Population Employed in Transportation & Warehousing in Massachusetts
RELATED REPORTS & OPTIONS
Transportation & Warehousing
Massachusetts
Compare Zip Codes
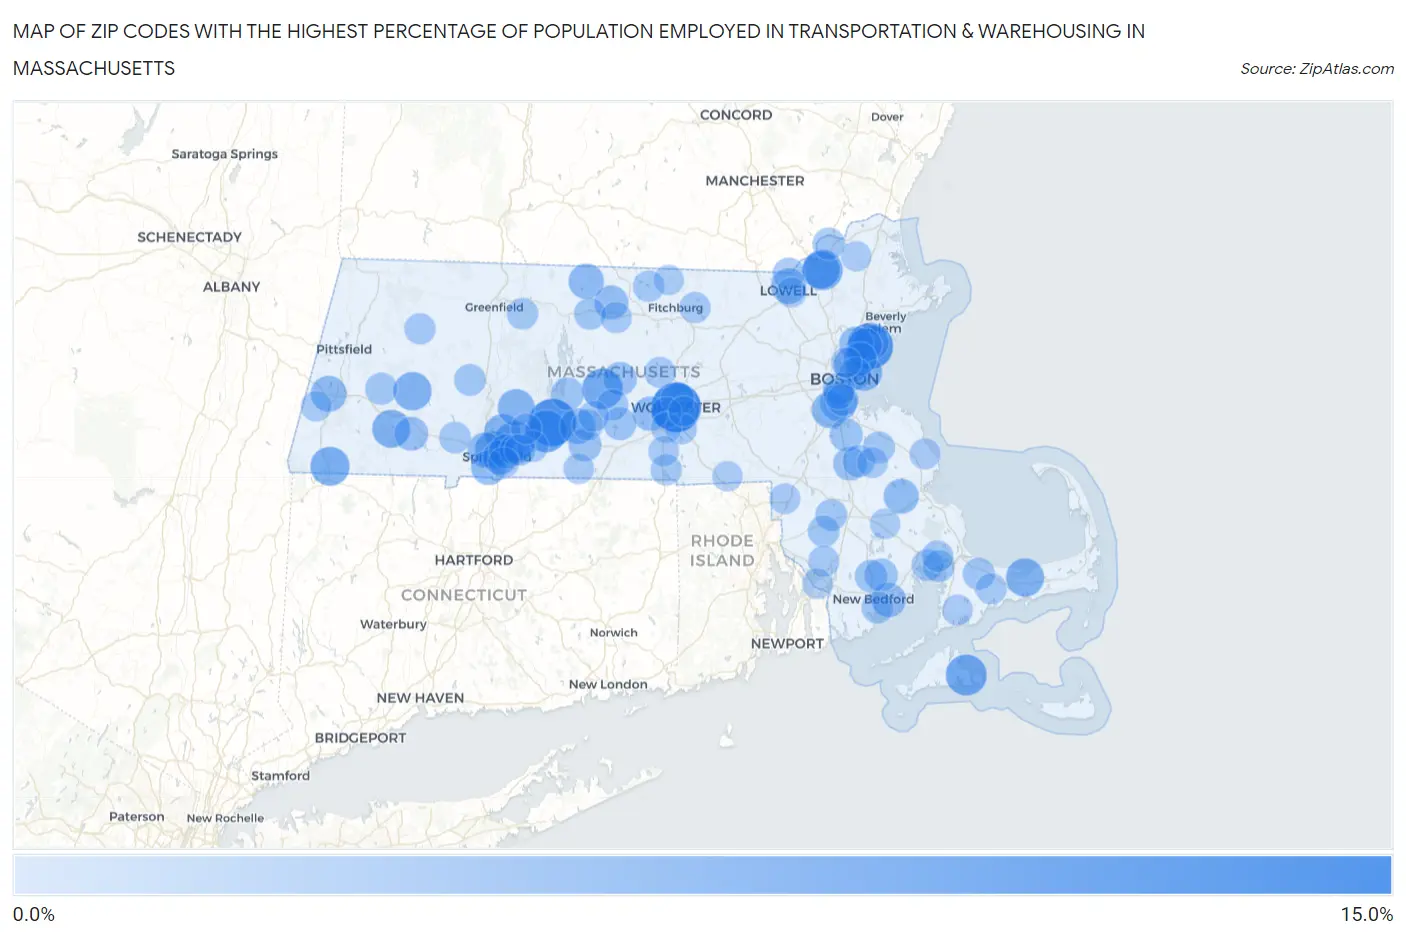
Map of Zip Codes with the Highest Percentage of Population Employed in Transportation & Warehousing in Massachusetts
0.0%
15.0%
Zip Codes with the Highest Percentage of Population Employed in Transportation & Warehousing in Massachusetts
| Zip Code | % Employed | vs State | vs National | |
| 1. | 01608 | 14.9% | 3.5%(+11.4)#1 | 4.9%(+9.97)#1,083 |
| 2. | 01009 | 13.7% | 3.5%(+10.2)#2 | 4.9%(+8.75)#1,348 |
| 3. | 01901 | 13.2% | 3.5%(+9.67)#3 | 4.9%(+8.25)#1,485 |
| 4. | 01080 | 11.0% | 3.5%(+7.48)#4 | 4.9%(+6.06)#2,322 |
| 5. | 02539 | 10.3% | 3.5%(+6.81)#5 | 4.9%(+5.38)#2,691 |
| 6. | 01531 | 10.3% | 3.5%(+6.73)#6 | 4.9%(+5.31)#2,729 |
| 7. | 01840 | 10.1% | 3.5%(+6.57)#7 | 4.9%(+5.15)#2,829 |
| 8. | 01151 | 10.0% | 3.5%(+6.48)#8 | 4.9%(+5.05)#2,897 |
| 9. | 01222 | 9.4% | 3.5%(+5.92)#9 | 4.9%(+4.50)#3,278 |
| 10. | 01011 | 9.0% | 3.5%(+5.45)#10 | 4.9%(+4.03)#3,723 |
| 11. | 02637 | 9.0% | 3.5%(+5.43)#11 | 4.9%(+4.01)#3,748 |
| 12. | 01029 | 8.9% | 3.5%(+5.34)#12 | 4.9%(+3.92)#3,854 |
| 13. | 01107 | 8.7% | 3.5%(+5.16)#13 | 4.9%(+3.73)#4,069 |
| 14. | 01841 | 8.6% | 3.5%(+5.06)#14 | 4.9%(+3.63)#4,180 |
| 15. | 02126 | 8.4% | 3.5%(+4.90)#15 | 4.9%(+3.47)#4,370 |
| 16. | 01020 | 8.3% | 3.5%(+4.80)#16 | 4.9%(+3.37)#4,497 |
| 17. | 02152 | 8.3% | 3.5%(+4.79)#17 | 4.9%(+3.37)#4,501 |
| 18. | 01033 | 8.3% | 3.5%(+4.74)#18 | 4.9%(+3.31)#4,565 |
| 19. | 02136 | 8.0% | 3.5%(+4.52)#19 | 4.9%(+3.10)#4,832 |
| 20. | 01262 | 7.8% | 3.5%(+4.27)#20 | 4.9%(+2.84)#5,198 |
| 21. | 01092 | 7.7% | 3.5%(+4.22)#21 | 4.9%(+2.80)#5,258 |
| 22. | 01850 | 7.6% | 3.5%(+4.05)#22 | 4.9%(+2.62)#5,536 |
| 23. | 01368 | 7.5% | 3.5%(+3.98)#23 | 4.9%(+2.55)#5,641 |
| 24. | 01089 | 7.4% | 3.5%(+3.90)#24 | 4.9%(+2.47)#5,791 |
| 25. | 02367 | 7.4% | 3.5%(+3.88)#25 | 4.9%(+2.46)#5,816 |
| 26. | 01902 | 7.4% | 3.5%(+3.88)#26 | 4.9%(+2.45)#5,825 |
| 27. | 02150 | 7.4% | 3.5%(+3.87)#27 | 4.9%(+2.44)#5,838 |
| 28. | 01001 | 7.4% | 3.5%(+3.86)#28 | 4.9%(+2.44)#5,847 |
| 29. | 01524 | 7.1% | 3.5%(+3.53)#29 | 4.9%(+2.11)#6,440 |
| 30. | 01105 | 7.1% | 3.5%(+3.53)#30 | 4.9%(+2.11)#6,447 |
| 31. | 01906 | 7.0% | 3.5%(+3.51)#31 | 4.9%(+2.09)#6,488 |
| 32. | 02719 | 7.0% | 3.5%(+3.49)#32 | 4.9%(+2.07)#6,532 |
| 33. | 01109 | 7.0% | 3.5%(+3.49)#33 | 4.9%(+2.06)#6,544 |
| 34. | 01436 | 6.9% | 3.5%(+3.33)#34 | 4.9%(+1.91)#6,843 |
| 35. | 01008 | 6.8% | 3.5%(+3.29)#35 | 4.9%(+1.86)#6,947 |
| 36. | 01905 | 6.8% | 3.5%(+3.27)#36 | 4.9%(+1.85)#6,983 |
| 37. | 01068 | 6.6% | 3.5%(+3.13)#37 | 4.9%(+1.70)#7,278 |
| 38. | 02301 | 6.6% | 3.5%(+3.12)#38 | 4.9%(+1.70)#7,286 |
| 39. | 01605 | 6.6% | 3.5%(+3.03)#39 | 4.9%(+1.61)#7,461 |
| 40. | 02151 | 6.5% | 3.5%(+3.02)#40 | 4.9%(+1.60)#7,482 |
| 41. | 02368 | 6.3% | 3.5%(+2.83)#41 | 4.9%(+1.40)#7,936 |
| 42. | 02743 | 6.3% | 3.5%(+2.78)#42 | 4.9%(+1.35)#8,047 |
| 43. | 01515 | 6.3% | 3.5%(+2.74)#43 | 4.9%(+1.32)#8,137 |
| 44. | 01082 | 6.2% | 3.5%(+2.72)#44 | 4.9%(+1.30)#8,193 |
| 45. | 02745 | 6.2% | 3.5%(+2.71)#45 | 4.9%(+1.29)#8,221 |
| 46. | 01010 | 6.2% | 3.5%(+2.68)#46 | 4.9%(+1.26)#8,279 |
| 47. | 02128 | 6.2% | 3.5%(+2.68)#47 | 4.9%(+1.25)#8,286 |
| 48. | 01832 | 6.0% | 3.5%(+2.45)#48 | 4.9%(+1.02)#8,869 |
| 49. | 02302 | 5.9% | 3.5%(+2.41)#49 | 4.9%(+0.984)#8,949 |
| 50. | 02563 | 5.9% | 3.5%(+2.37)#50 | 4.9%(+0.944)#9,054 |
| 51. | 01826 | 5.9% | 3.5%(+2.37)#51 | 4.9%(+0.943)#9,058 |
| 52. | 01223 | 5.9% | 3.5%(+2.33)#52 | 4.9%(+0.905)#9,186 |
| 53. | 02119 | 5.8% | 3.5%(+2.32)#53 | 4.9%(+0.896)#9,215 |
| 54. | 01331 | 5.8% | 3.5%(+2.27)#54 | 4.9%(+0.846)#9,364 |
| 55. | 02744 | 5.8% | 3.5%(+2.25)#55 | 4.9%(+0.821)#9,444 |
| 56. | 02780 | 5.7% | 3.5%(+2.22)#56 | 4.9%(+0.800)#9,522 |
| 57. | 02124 | 5.7% | 3.5%(+2.22)#57 | 4.9%(+0.797)#9,530 |
| 58. | 01053 | 5.7% | 3.5%(+2.20)#58 | 4.9%(+0.772)#9,604 |
| 59. | 02571 | 5.7% | 3.5%(+2.19)#59 | 4.9%(+0.762)#9,633 |
| 60. | 02370 | 5.7% | 3.5%(+2.18)#60 | 4.9%(+0.758)#9,645 |
| 61. | 02764 | 5.7% | 3.5%(+2.17)#61 | 4.9%(+0.744)#9,693 |
| 62. | 02558 | 5.7% | 3.5%(+2.16)#62 | 4.9%(+0.740)#9,704 |
| 63. | 01085 | 5.6% | 3.5%(+2.12)#63 | 4.9%(+0.699)#9,824 |
| 64. | 01535 | 5.6% | 3.5%(+2.11)#64 | 4.9%(+0.684)#9,863 |
| 65. | 01095 | 5.6% | 3.5%(+2.09)#65 | 4.9%(+0.668)#9,919 |
| 66. | 01349 | 5.6% | 3.5%(+2.05)#66 | 4.9%(+0.623)#10,036 |
| 67. | 01430 | 5.5% | 3.5%(+2.01)#67 | 4.9%(+0.585)#10,152 |
| 68. | 02538 | 5.5% | 3.5%(+1.99)#68 | 4.9%(+0.567)#10,200 |
| 69. | 01527 | 5.5% | 3.5%(+1.96)#69 | 4.9%(+0.532)#10,323 |
| 70. | 01070 | 5.5% | 3.5%(+1.95)#70 | 4.9%(+0.528)#10,331 |
| 71. | 01468 | 5.4% | 3.5%(+1.93)#71 | 4.9%(+0.501)#10,401 |
| 72. | 01462 | 5.4% | 3.5%(+1.92)#72 | 4.9%(+0.499)#10,413 |
| 73. | 01119 | 5.4% | 3.5%(+1.92)#73 | 4.9%(+0.492)#10,435 |
| 74. | 01522 | 5.4% | 3.5%(+1.85)#74 | 4.9%(+0.424)#10,677 |
| 75. | 01129 | 5.4% | 3.5%(+1.84)#75 | 4.9%(+0.418)#10,699 |
| 76. | 02726 | 5.4% | 3.5%(+1.84)#76 | 4.9%(+0.417)#10,702 |
| 77. | 01570 | 5.4% | 3.5%(+1.84)#77 | 4.9%(+0.417)#10,703 |
| 78. | 02121 | 5.4% | 3.5%(+1.84)#78 | 4.9%(+0.413)#10,718 |
| 79. | 02648 | 5.3% | 3.5%(+1.81)#79 | 4.9%(+0.381)#10,831 |
| 80. | 01083 | 5.3% | 3.5%(+1.79)#80 | 4.9%(+0.366)#10,879 |
| 81. | 01603 | 5.3% | 3.5%(+1.79)#81 | 4.9%(+0.363)#10,888 |
| 82. | 02050 | 5.3% | 3.5%(+1.73)#82 | 4.9%(+0.304)#11,067 |
| 83. | 02382 | 5.2% | 3.5%(+1.72)#83 | 4.9%(+0.294)#11,096 |
| 84. | 01108 | 5.2% | 3.5%(+1.72)#84 | 4.9%(+0.294)#11,098 |
| 85. | 02760 | 5.2% | 3.5%(+1.70)#85 | 4.9%(+0.272)#11,178 |
| 86. | 01585 | 5.2% | 3.5%(+1.69)#86 | 4.9%(+0.263)#11,206 |
| 87. | 01501 | 5.2% | 3.5%(+1.68)#87 | 4.9%(+0.257)#11,230 |
| 88. | 01056 | 5.2% | 3.5%(+1.66)#88 | 4.9%(+0.232)#11,317 |
| 89. | 01540 | 5.1% | 3.5%(+1.61)#89 | 4.9%(+0.184)#11,508 |
| 90. | 02536 | 5.1% | 3.5%(+1.59)#90 | 4.9%(+0.169)#11,559 |
| 91. | 01081 | 5.1% | 3.5%(+1.58)#91 | 4.9%(+0.151)#11,626 |
| 92. | 01236 | 5.1% | 3.5%(+1.54)#92 | 4.9%(+0.118)#11,741 |
| 93. | 02149 | 5.1% | 3.5%(+1.54)#93 | 4.9%(+0.116)#11,751 |
| 94. | 01529 | 5.1% | 3.5%(+1.53)#94 | 4.9%(+0.106)#11,774 |
| 95. | 01604 | 5.0% | 3.5%(+1.51)#95 | 4.9%(+0.087)#11,843 |
| 96. | 01834 | 5.0% | 3.5%(+1.49)#96 | 4.9%(+0.063)#11,900 |
| 97. | 02724 | 5.0% | 3.5%(+1.48)#97 | 4.9%(+0.057)#11,917 |
| 98. | 01431 | 5.0% | 3.5%(+1.47)#98 | 4.9%(+0.043)#11,980 |
| 99. | 02346 | 5.0% | 3.5%(+1.45)#99 | 4.9%(+0.025)#12,035 |
| 100. | 01852 | 5.0% | 3.5%(+1.44)#100 | 4.9%(+0.012)#12,071 |
Common Questions
What are the Top 10 Zip Codes with the Highest Percentage of Population Employed in Transportation & Warehousing in Massachusetts?
Top 10 Zip Codes with the Highest Percentage of Population Employed in Transportation & Warehousing in Massachusetts are:
What zip code has the Highest Percentage of Population Employed in Transportation & Warehousing in Massachusetts?
01608 has the Highest Percentage of Population Employed in Transportation & Warehousing in Massachusetts with 14.9%.
What is the Percentage of Population Employed in Transportation & Warehousing in the State of Massachusetts?
Percentage of Population Employed in Transportation & Warehousing in Massachusetts is 3.5%.
What is the Percentage of Population Employed in Transportation & Warehousing in the United States?
Percentage of Population Employed in Transportation & Warehousing in the United States is 4.9%.