Zip Codes with the Highest Percentage of Population Employed in Farming, Fishing & Forestry in Quincy, MA
RELATED REPORTS & OPTIONS
Farming, Fishing & Forestry
Quincy
Compare Zip Codes
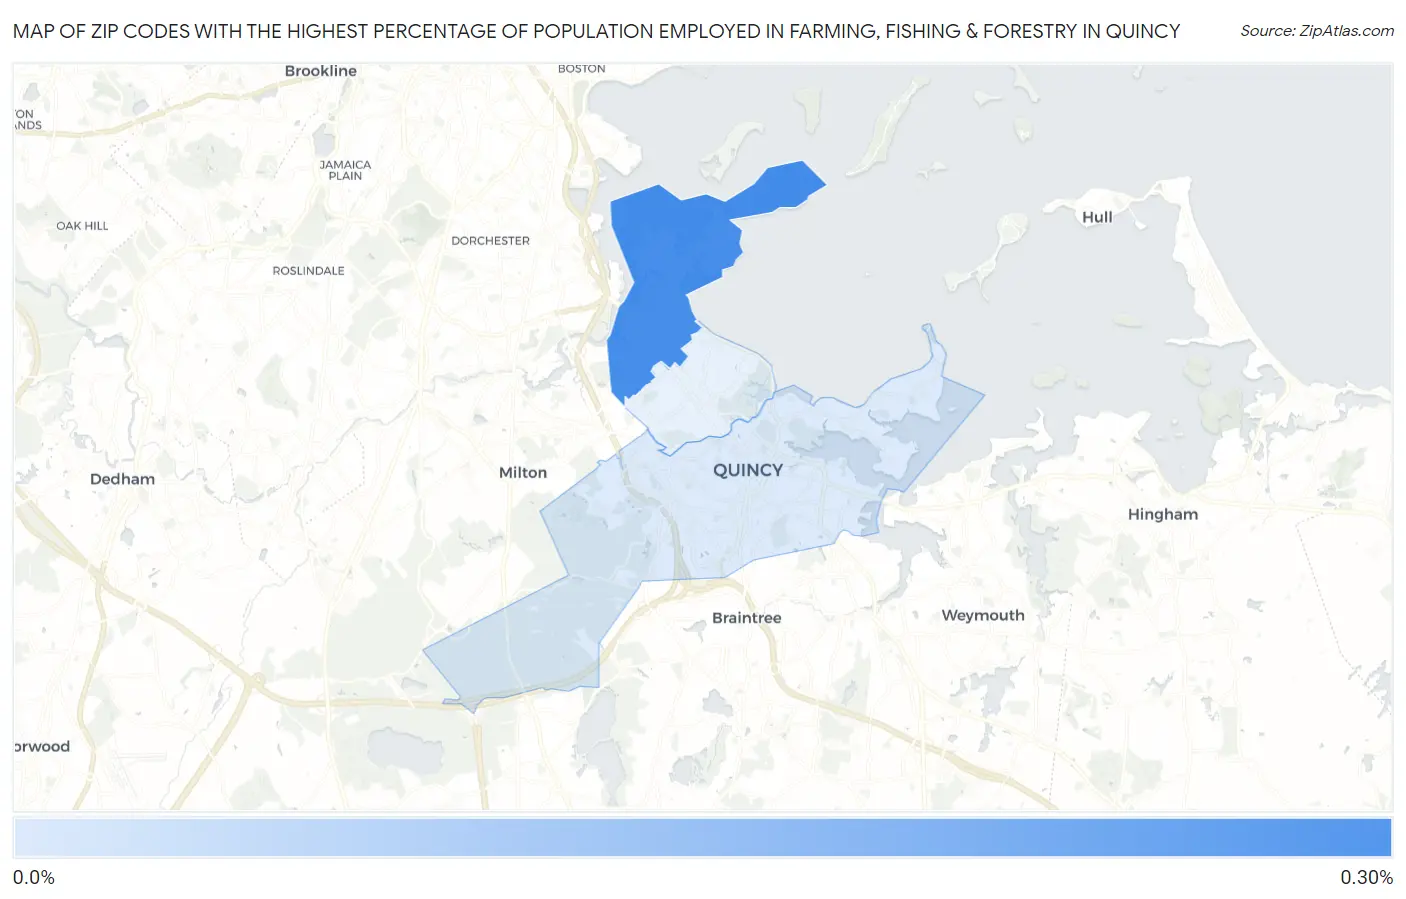
Map of Zip Codes with the Highest Percentage of Population Employed in Farming, Fishing & Forestry in Quincy
0.0%
0.30%
Zip Codes with the Highest Percentage of Population Employed in Farming, Fishing & Forestry in Quincy, MA
| Zip Code | % Employed | vs State | vs National | |
| 1. | 02171 | 0.28% | 0.22%(+0.063)#157 | 0.61%(-0.327)#15,086 |
| 2. | 02169 | 0.023% | 0.22%(-0.192)#249 | 0.61%(-0.582)#19,035 |
1
Common Questions
What are the Top Zip Codes with the Highest Percentage of Population Employed in Farming, Fishing & Forestry in Quincy, MA?
Top Zip Codes with the Highest Percentage of Population Employed in Farming, Fishing & Forestry in Quincy, MA are:
What zip code has the Highest Percentage of Population Employed in Farming, Fishing & Forestry in Quincy, MA?
02171 has the Highest Percentage of Population Employed in Farming, Fishing & Forestry in Quincy, MA with 0.28%.
What is the Percentage of Population Employed in Farming, Fishing & Forestry in Quincy, MA?
Percentage of Population Employed in Farming, Fishing & Forestry in Quincy is 0.071%.
What is the Percentage of Population Employed in Farming, Fishing & Forestry in Massachusetts?
Percentage of Population Employed in Farming, Fishing & Forestry in Massachusetts is 0.22%.
What is the Percentage of Population Employed in Farming, Fishing & Forestry in the United States?
Percentage of Population Employed in Farming, Fishing & Forestry in the United States is 0.61%.