Zip Codes with the Highest Percentage of Population Employed in Finance & Insurance in Northampton, MA
RELATED REPORTS & OPTIONS
Select to Compare
Select to Compare
Compare Zip Codes
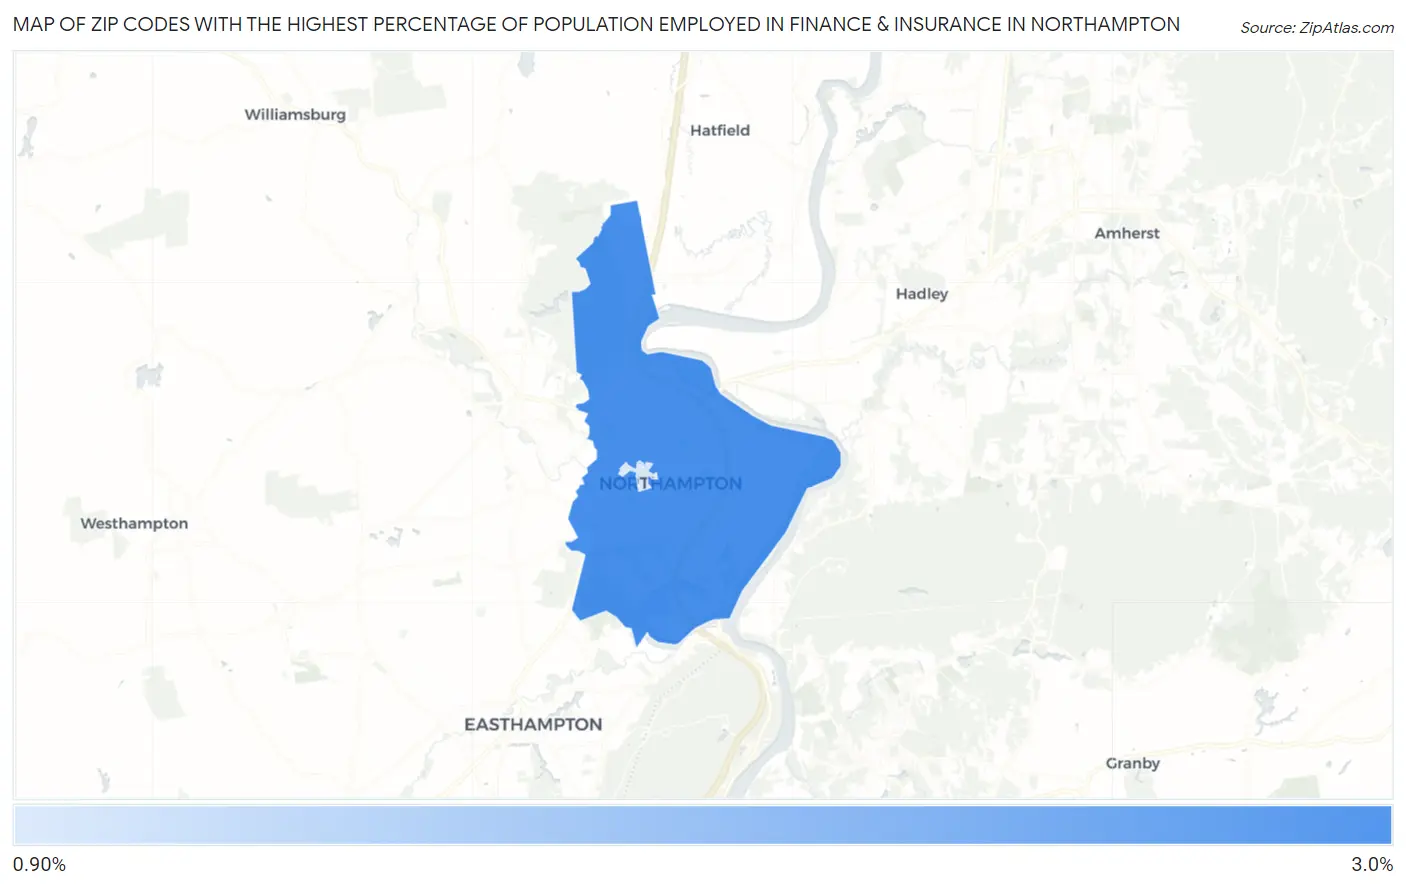
Map of Zip Codes with the Highest Percentage of Population Employed in Finance & Insurance in Northampton
0.0%
2.0%
Zip Codes with the Highest Percentage of Population Employed in Finance & Insurance in Northampton, MA
| Zip Code | % Employed | vs State | vs National | |
| 1. | 01060 | 1.9% | 5.6%(-3.71)#452 | 4.8%(-2.85)#20,853 |
1
Common Questions
What are the Top Zip Codes with the Highest Percentage of Population Employed in Finance & Insurance in Northampton, MA?
Top Zip Codes with the Highest Percentage of Population Employed in Finance & Insurance in Northampton, MA are:
What zip code has the Highest Percentage of Population Employed in Finance & Insurance in Northampton, MA?
01060 has the Highest Percentage of Population Employed in Finance & Insurance in Northampton, MA with 1.9%.
What is the Percentage of Population Employed in Finance & Insurance in Northampton, MA?
Percentage of Population Employed in Finance & Insurance in Northampton is 2.0%.
What is the Percentage of Population Employed in Finance & Insurance in Massachusetts?
Percentage of Population Employed in Finance & Insurance in Massachusetts is 5.6%.
What is the Percentage of Population Employed in Finance & Insurance in the United States?
Percentage of Population Employed in Finance & Insurance in the United States is 4.8%.