Zip Codes with the Highest Percentage of Population Employed in Agriculture, Fishing & Hunting in Northampton, MA
RELATED REPORTS & OPTIONS
Agriculture, Fishing & Hunting
Northampton
Compare Zip Codes
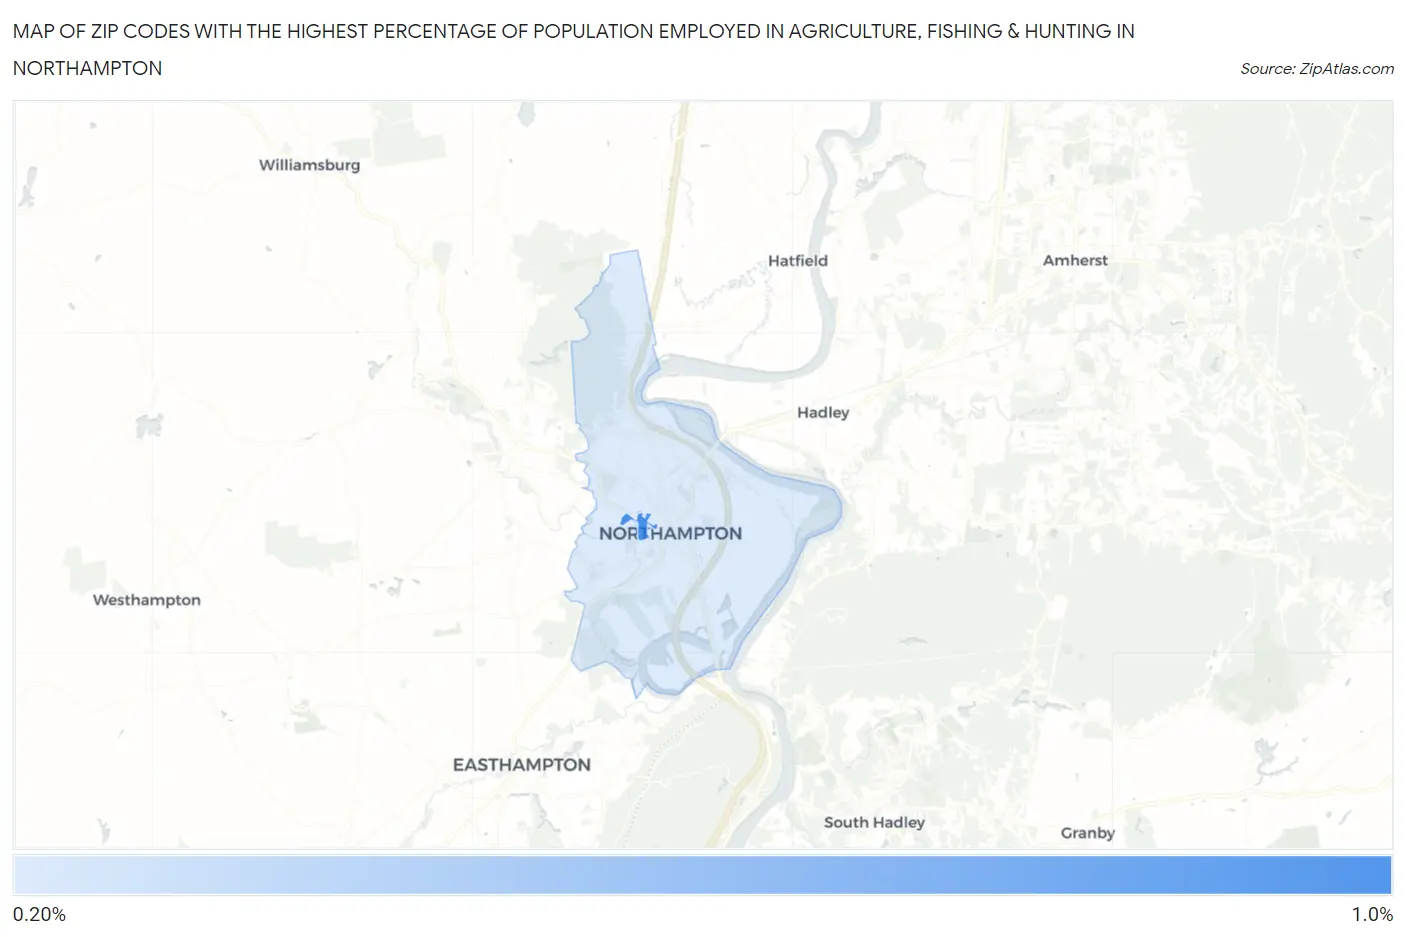
Map of Zip Codes with the Highest Percentage of Population Employed in Agriculture, Fishing & Hunting in Northampton
0.0%
1.0%
Zip Codes with the Highest Percentage of Population Employed in Agriculture, Fishing & Hunting in Northampton, MA
| Zip Code | % Employed | vs State | vs National | |
| 1. | 01063 | 0.93% | 0.39%(+0.540)#123 | 1.2%(-0.265)#16,536 |
| 2. | 01060 | 0.27% | 0.39%(-0.125)#258 | 1.2%(-0.930)#21,545 |
1
Common Questions
What are the Top Zip Codes with the Highest Percentage of Population Employed in Agriculture, Fishing & Hunting in Northampton, MA?
Top Zip Codes with the Highest Percentage of Population Employed in Agriculture, Fishing & Hunting in Northampton, MA are:
What zip code has the Highest Percentage of Population Employed in Agriculture, Fishing & Hunting in Northampton, MA?
01063 has the Highest Percentage of Population Employed in Agriculture, Fishing & Hunting in Northampton, MA with 0.93%.
What is the Percentage of Population Employed in Agriculture, Fishing & Hunting in Northampton, MA?
Percentage of Population Employed in Agriculture, Fishing & Hunting in Northampton is 0.50%.
What is the Percentage of Population Employed in Agriculture, Fishing & Hunting in Massachusetts?
Percentage of Population Employed in Agriculture, Fishing & Hunting in Massachusetts is 0.39%.
What is the Percentage of Population Employed in Agriculture, Fishing & Hunting in the United States?
Percentage of Population Employed in Agriculture, Fishing & Hunting in the United States is 1.2%.