Zip Codes with the Highest Percentage of Population Employed in Farming, Fishing & Forestry in Northampton, MA
RELATED REPORTS & OPTIONS
Farming, Fishing & Forestry
Northampton
Compare Zip Codes
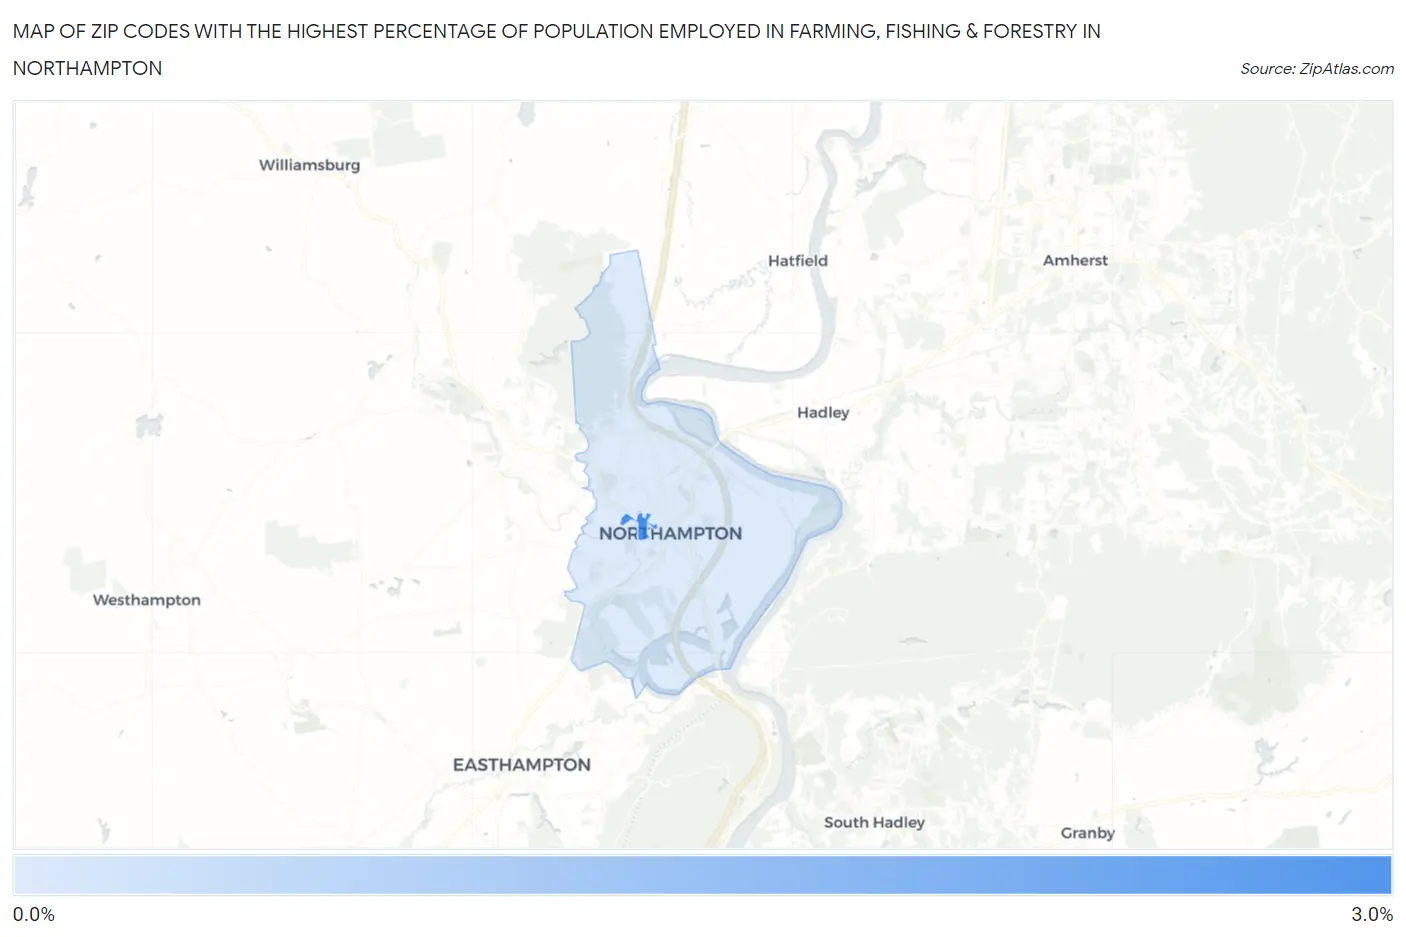
Map of Zip Codes with the Highest Percentage of Population Employed in Farming, Fishing & Forestry in Northampton
0.0%
3.0%
Zip Codes with the Highest Percentage of Population Employed in Farming, Fishing & Forestry in Northampton, MA
| Zip Code | % Employed | vs State | vs National | |
| 1. | 01063 | 2.6% | 0.22%(+2.35)#18 | 0.61%(+1.96)#5,431 |
| 2. | 01060 | 0.061% | 0.22%(-0.154)#232 | 0.61%(-0.544)#18,447 |
1
Common Questions
What are the Top Zip Codes with the Highest Percentage of Population Employed in Farming, Fishing & Forestry in Northampton, MA?
Top Zip Codes with the Highest Percentage of Population Employed in Farming, Fishing & Forestry in Northampton, MA are:
What zip code has the Highest Percentage of Population Employed in Farming, Fishing & Forestry in Northampton, MA?
01063 has the Highest Percentage of Population Employed in Farming, Fishing & Forestry in Northampton, MA with 2.6%.
What is the Percentage of Population Employed in Farming, Fishing & Forestry in Northampton, MA?
Percentage of Population Employed in Farming, Fishing & Forestry in Northampton is 0.19%.
What is the Percentage of Population Employed in Farming, Fishing & Forestry in Massachusetts?
Percentage of Population Employed in Farming, Fishing & Forestry in Massachusetts is 0.22%.
What is the Percentage of Population Employed in Farming, Fishing & Forestry in the United States?
Percentage of Population Employed in Farming, Fishing & Forestry in the United States is 0.61%.