Zip Codes with the Highest Percentage of Population Employed in Farming, Fishing & Forestry in New Bedford, MA
RELATED REPORTS & OPTIONS
Farming, Fishing & Forestry
New Bedford
Compare Zip Codes
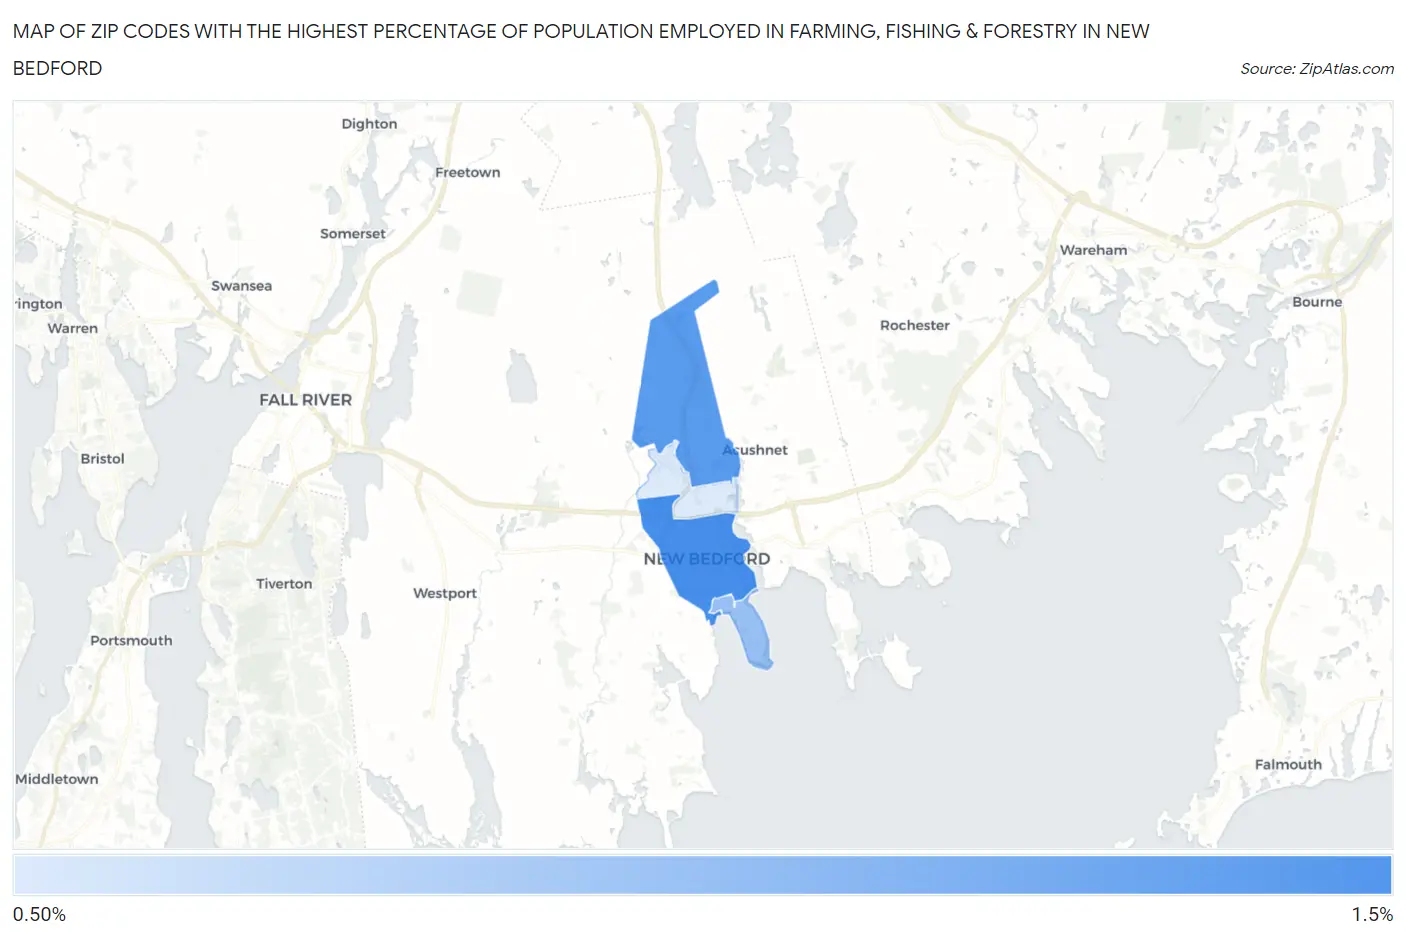
Map of Zip Codes with the Highest Percentage of Population Employed in Farming, Fishing & Forestry in New Bedford
0.0%
1.5%
Zip Codes with the Highest Percentage of Population Employed in Farming, Fishing & Forestry in New Bedford, MA
| Zip Code | % Employed | vs State | vs National | |
| 1. | 02740 | 1.3% | 0.22%(+1.04)#40 | 0.61%(+0.654)#8,724 |
| 2. | 02745 | 1.2% | 0.22%(+1.00)#43 | 0.61%(+0.614)#8,859 |
| 3. | 02744 | 1.0% | 0.22%(+0.833)#49 | 0.61%(+0.443)#9,521 |
| 4. | 02746 | 0.86% | 0.22%(+0.648)#66 | 0.61%(+0.258)#10,437 |
1
Common Questions
What are the Top 3 Zip Codes with the Highest Percentage of Population Employed in Farming, Fishing & Forestry in New Bedford, MA?
Top 3 Zip Codes with the Highest Percentage of Population Employed in Farming, Fishing & Forestry in New Bedford, MA are:
What zip code has the Highest Percentage of Population Employed in Farming, Fishing & Forestry in New Bedford, MA?
02740 has the Highest Percentage of Population Employed in Farming, Fishing & Forestry in New Bedford, MA with 1.3%.
What is the Percentage of Population Employed in Farming, Fishing & Forestry in New Bedford, MA?
Percentage of Population Employed in Farming, Fishing & Forestry in New Bedford is 1.2%.
What is the Percentage of Population Employed in Farming, Fishing & Forestry in Massachusetts?
Percentage of Population Employed in Farming, Fishing & Forestry in Massachusetts is 0.22%.
What is the Percentage of Population Employed in Farming, Fishing & Forestry in the United States?
Percentage of Population Employed in Farming, Fishing & Forestry in the United States is 0.61%.