Zip Codes with the Highest Percentage of Population Employed in Farming, Fishing & Forestry in Lexington, MA
RELATED REPORTS & OPTIONS
Farming, Fishing & Forestry
Lexington
Compare Zip Codes
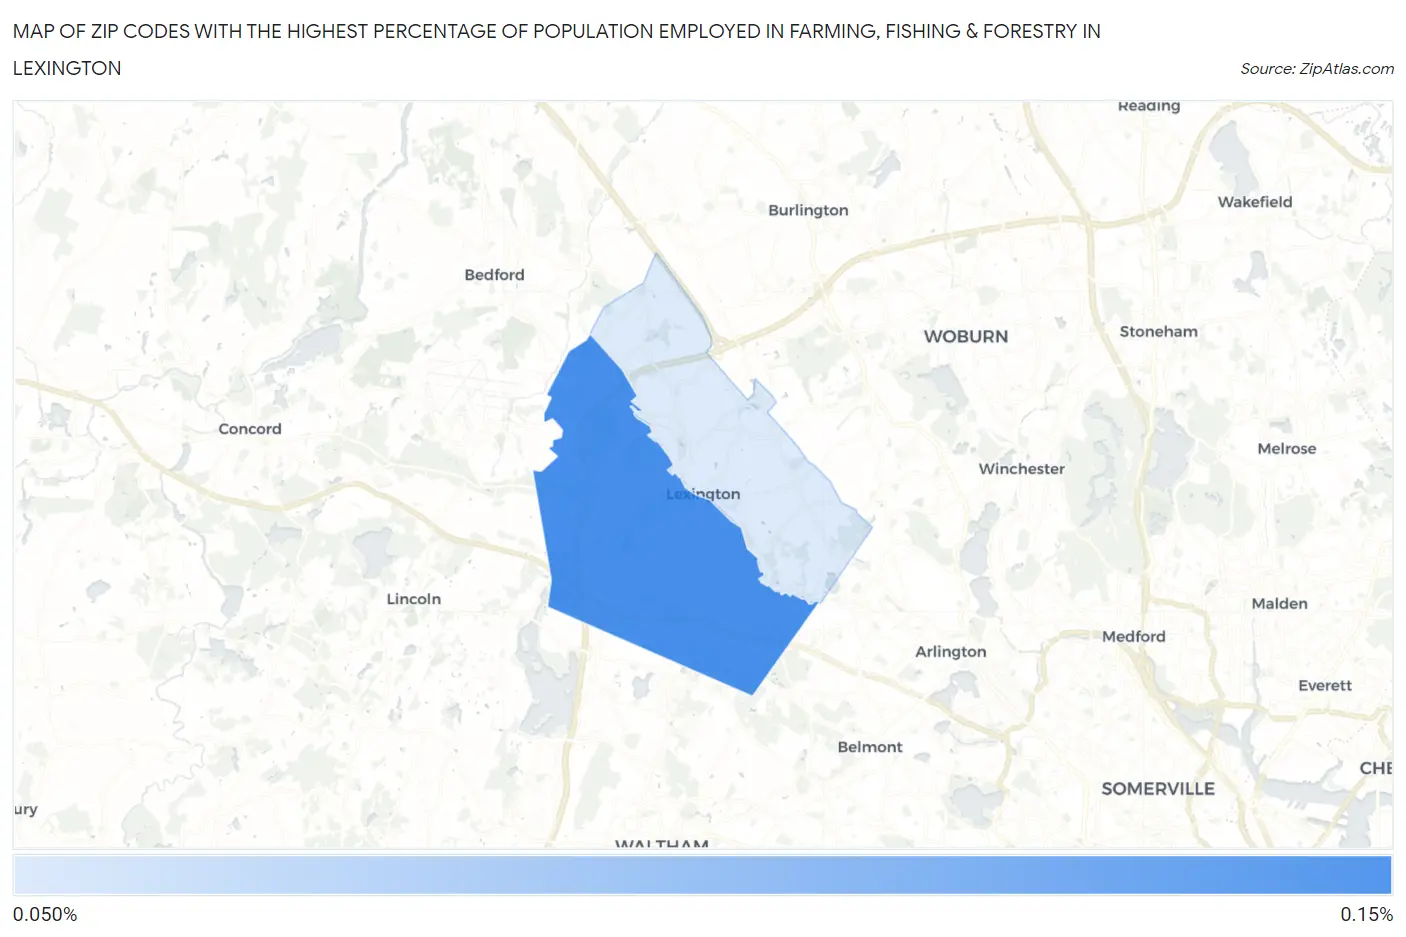
Map of Zip Codes with the Highest Percentage of Population Employed in Farming, Fishing & Forestry in Lexington
0.0%
0.15%
Zip Codes with the Highest Percentage of Population Employed in Farming, Fishing & Forestry in Lexington, MA
| Zip Code | % Employed | vs State | vs National | |
| 1. | 02421 | 0.14% | 0.22%(-0.072)#204 | 0.61%(-0.462)#17,030 |
| 2. | 02420 | 0.12% | 0.22%(-0.090)#215 | 0.61%(-0.481)#17,351 |
1
Common Questions
What are the Top Zip Codes with the Highest Percentage of Population Employed in Farming, Fishing & Forestry in Lexington, MA?
Top Zip Codes with the Highest Percentage of Population Employed in Farming, Fishing & Forestry in Lexington, MA are:
What zip code has the Highest Percentage of Population Employed in Farming, Fishing & Forestry in Lexington, MA?
02421 has the Highest Percentage of Population Employed in Farming, Fishing & Forestry in Lexington, MA with 0.14%.
What is the Percentage of Population Employed in Farming, Fishing & Forestry in Lexington, MA?
Percentage of Population Employed in Farming, Fishing & Forestry in Lexington is 0.13%.
What is the Percentage of Population Employed in Farming, Fishing & Forestry in Massachusetts?
Percentage of Population Employed in Farming, Fishing & Forestry in Massachusetts is 0.22%.
What is the Percentage of Population Employed in Farming, Fishing & Forestry in the United States?
Percentage of Population Employed in Farming, Fishing & Forestry in the United States is 0.61%.