Zip Codes with the Highest Percentage of Population Employed in Arts, Entertainment & Recreation in Haverhill, MA
RELATED REPORTS & OPTIONS
Arts, Entertainment & Recreation
Haverhill
Compare Zip Codes
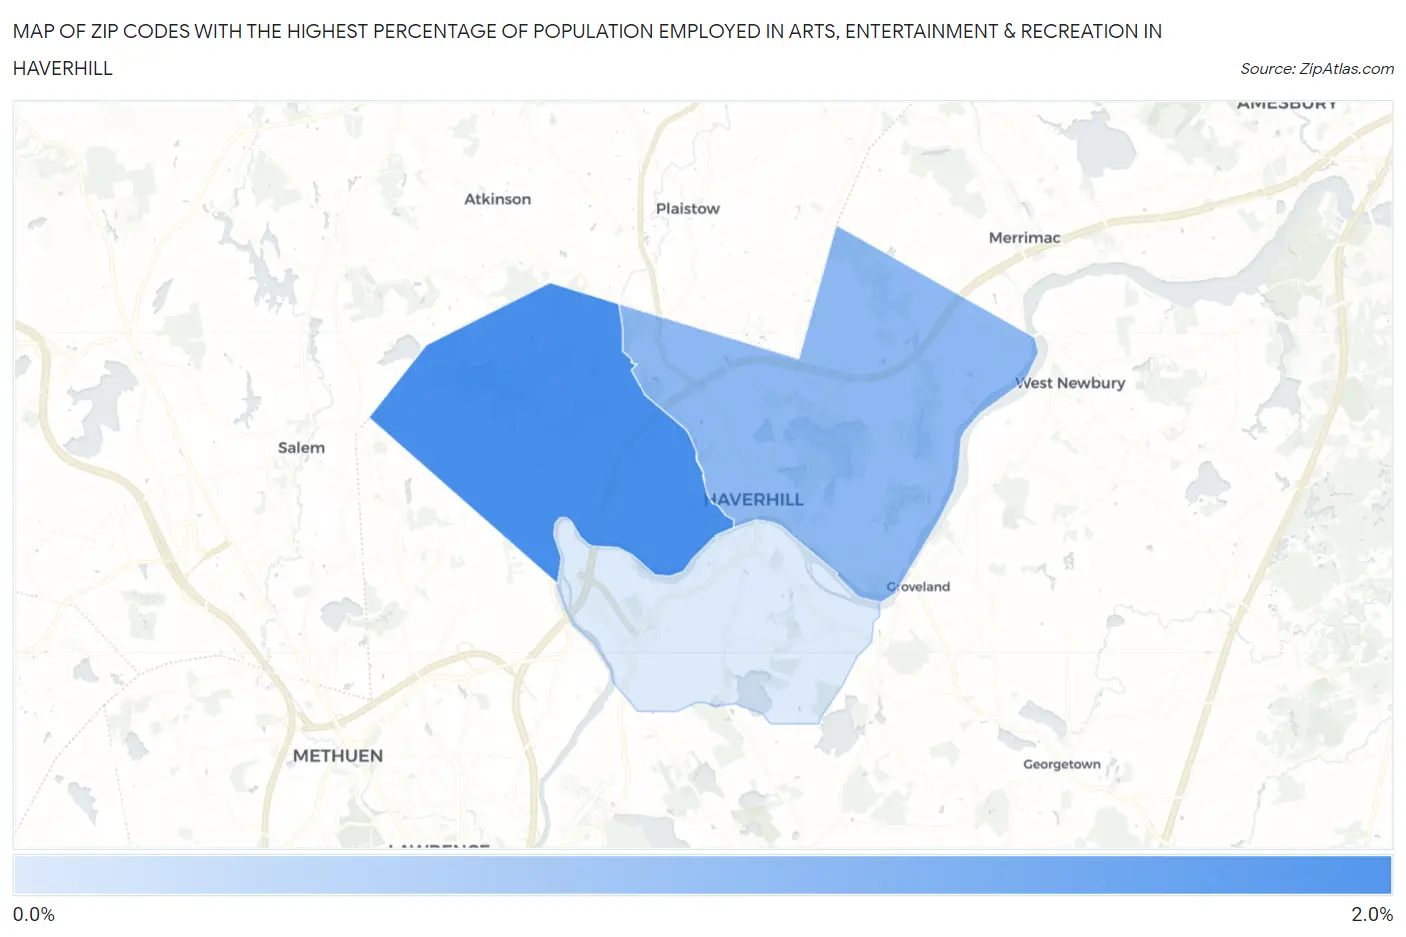
Map of Zip Codes with the Highest Percentage of Population Employed in Arts, Entertainment & Recreation in Haverhill
0.0%
2.0%
Zip Codes with the Highest Percentage of Population Employed in Arts, Entertainment & Recreation in Haverhill, MA
| Zip Code | % Employed | vs State | vs National | |
| 1. | 01832 | 2.0% | 2.0%(-0.008)#237 | 2.1%(-0.113)#9,953 |
| 2. | 01830 | 1.5% | 2.0%(-0.505)#326 | 2.1%(-0.609)#13,420 |
| 3. | 01835 | 0.90% | 2.0%(-1.08)#416 | 2.1%(-1.18)#17,695 |
1
Common Questions
What are the Top Zip Codes with the Highest Percentage of Population Employed in Arts, Entertainment & Recreation in Haverhill, MA?
Top Zip Codes with the Highest Percentage of Population Employed in Arts, Entertainment & Recreation in Haverhill, MA are:
What zip code has the Highest Percentage of Population Employed in Arts, Entertainment & Recreation in Haverhill, MA?
01832 has the Highest Percentage of Population Employed in Arts, Entertainment & Recreation in Haverhill, MA with 2.0%.
What is the Percentage of Population Employed in Arts, Entertainment & Recreation in Haverhill, MA?
Percentage of Population Employed in Arts, Entertainment & Recreation in Haverhill is 1.5%.
What is the Percentage of Population Employed in Arts, Entertainment & Recreation in Massachusetts?
Percentage of Population Employed in Arts, Entertainment & Recreation in Massachusetts is 2.0%.
What is the Percentage of Population Employed in Arts, Entertainment & Recreation in the United States?
Percentage of Population Employed in Arts, Entertainment & Recreation in the United States is 2.1%.