Zip Codes with the Highest Percentage of Households Residing in Detached Homes in Chicopee, MA
RELATED REPORTS & OPTIONS
Detached Home Residency
Chicopee
Compare Zip Codes
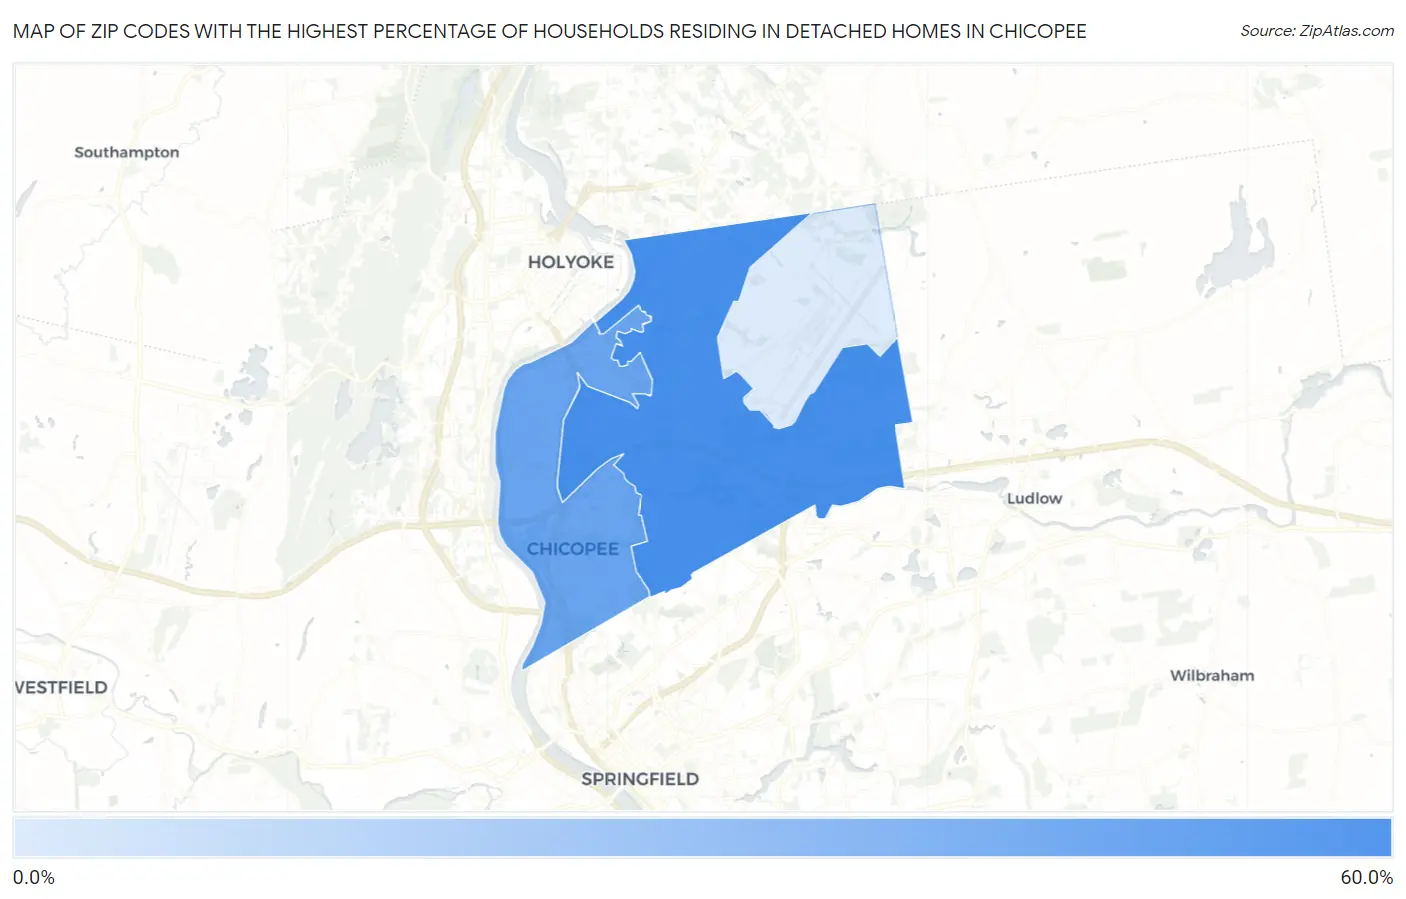
Map of Zip Codes with the Highest Percentage of Households Residing in Detached Homes in Chicopee
9.8%
55.9%
Zip Codes with the Highest Percentage of Households Residing in Detached Homes in Chicopee, MA
| Zip Code | Detached Home Residency | vs State | vs National | |
| 1. | 01020 | 55.9% | 51.3%(+4.60)#370 | 62.5%(-6.60)#27,822 |
| 2. | 01013 | 43.9% | 51.3%(-7.40)#422 | 62.5%(-18.6)#30,094 |
| 3. | 01022 | 9.8% | 51.3%(-41.5)#493 | 62.5%(-52.7)#32,132 |
1
Common Questions
What are the Top Zip Codes with the Highest Percentage of Households Residing in Detached Homes in Chicopee, MA?
Top Zip Codes with the Highest Percentage of Households Residing in Detached Homes in Chicopee, MA are:
What zip code has the Highest Percentage of Households Residing in Detached Homes in Chicopee, MA?
01020 has the Highest Percentage of Households Residing in Detached Homes in Chicopee, MA with 55.9%.
What is the Percentage of Households Residing in Detached Homes in Chicopee, MA?
Percentage of Households Residing in Detached Homes in Chicopee is 49.1%.
What is the Percentage of Households Residing in Detached Homes in Massachusetts?
Percentage of Households Residing in Detached Homes in Massachusetts is 51.3%.
What is the Percentage of Households Residing in Detached Homes in the United States?
Percentage of Households Residing in Detached Homes in the United States is 62.5%.