Zip Codes with the Highest Percentage of Hispanic or Latino Population in Monroe, LA
RELATED REPORTS & OPTIONS
Hispanic or Latino
Monroe
Compare Zip Codes
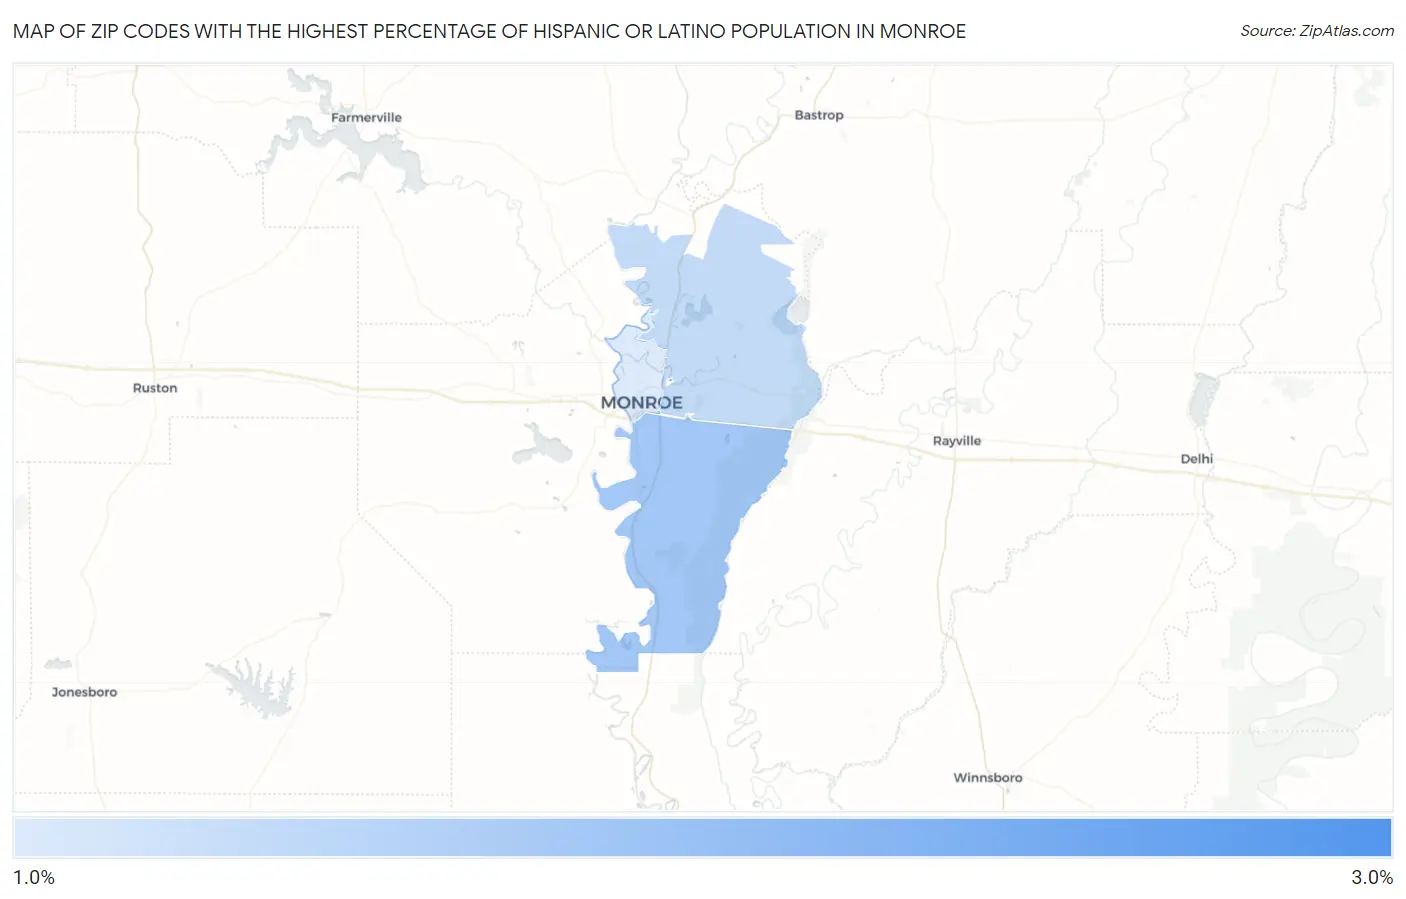
Map of Zip Codes with the Highest Percentage of Hispanic or Latino Population in Monroe
1.8%
2.9%
Zip Codes with the Highest Percentage of Hispanic or Latino Population in Monroe, LA
| Zip Code | Hispanic or Latino | vs State | vs National | |
| 1. | 71209 | 2.9% | 5.5%(-2.65)#239 | 18.7%(-15.8)#18,712 |
| 2. | 71202 | 2.2% | 5.5%(-3.33)#273 | 18.7%(-16.5)#20,529 |
| 3. | 71203 | 1.9% | 5.5%(-3.57)#291 | 18.7%(-16.7)#21,225 |
| 4. | 71201 | 1.8% | 5.5%(-3.75)#305 | 18.7%(-16.9)#21,768 |
1
Common Questions
What are the Top 3 Zip Codes with the Highest Percentage of Hispanic or Latino Population in Monroe, LA?
Top 3 Zip Codes with the Highest Percentage of Hispanic or Latino Population in Monroe, LA are:
What zip code has the Highest Percentage of Hispanic or Latino Population in Monroe, LA?
71209 has the Highest Percentage of Hispanic or Latino Population in Monroe, LA with 2.9%.
What is the Percentage of Hispanic or Latino Population in Monroe, LA?
Percentage of Hispanic or Latino Population in Monroe is 2.0%.
What is the Percentage of Hispanic or Latino Population in Louisiana?
Percentage of Hispanic or Latino Population in Louisiana is 5.5%.
What is the Percentage of Hispanic or Latino Population in the United States?
Percentage of Hispanic or Latino Population in the United States is 18.7%.