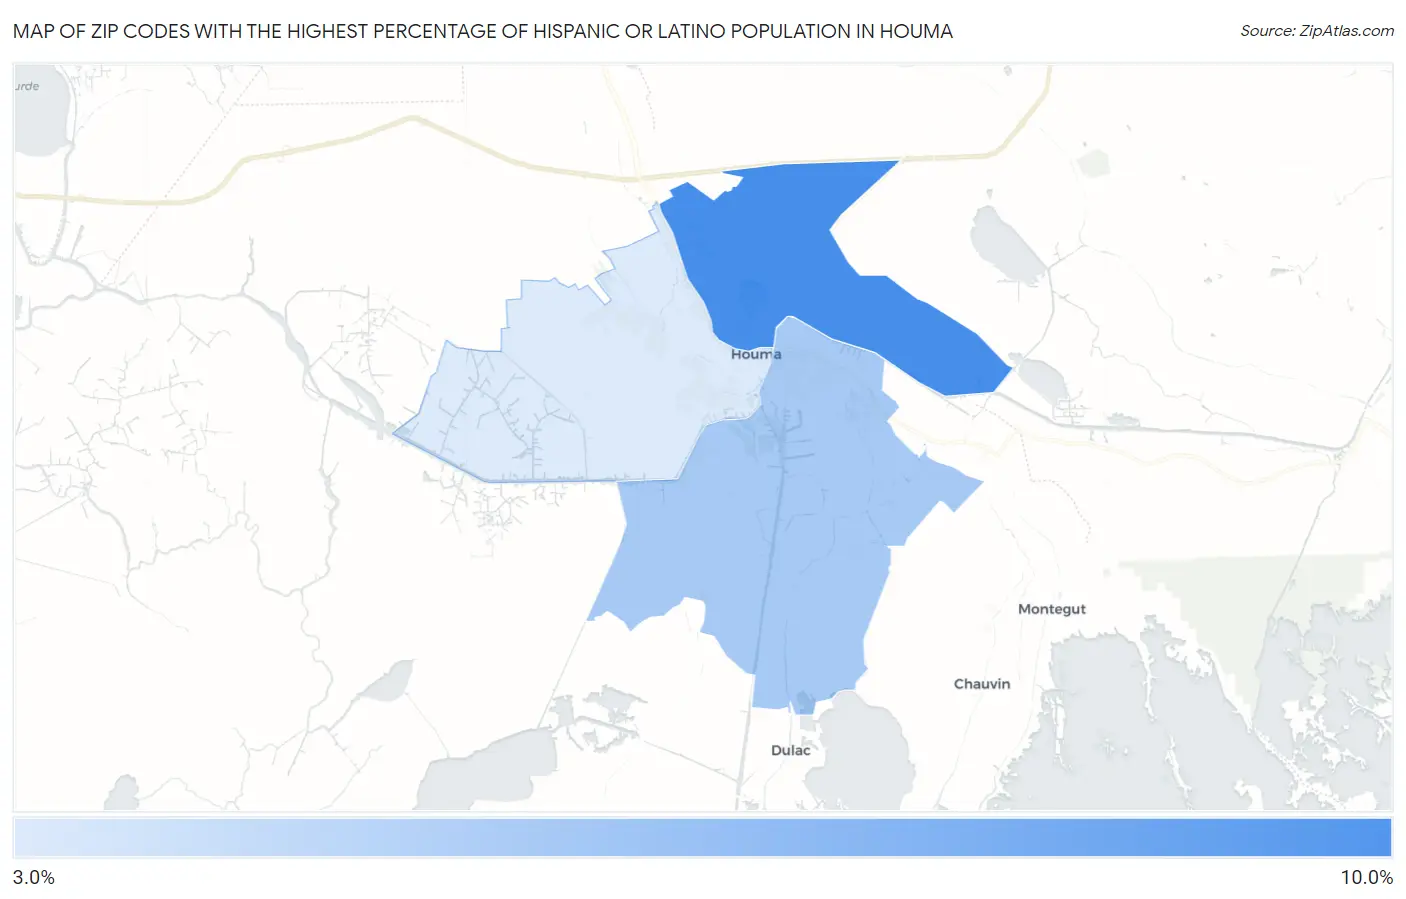
Zip Codes with the Highest Percentage of Hispanic or Latino Population in Houma, LA
RELATED REPORTS & OPTIONS
Hispanic or Latino
Houma
Compare Zip Codes
Map of Zip Codes with the Highest Percentage of Hispanic or Latino Population in Houma
0.0%
10.0%
Zip Codes with the Highest Percentage of Hispanic or Latino Population in Houma, LA
| Zip Code | Hispanic or Latino | vs State | vs National | |
| 1. | 70364 | 8.3% | 5.5%(+2.77)#72 | 18.7%(-10.4)#10,336 |
| 2. | 70363 | 5.1% | 5.5%(-0.384)#140 | 18.7%(-13.5)#14,076 |
| 3. | 70360 | 3.4% | 5.5%(-2.13)#204 | 18.7%(-15.3)#17,434 |
1
Common Questions
What are the Top Zip Codes with the Highest Percentage of Hispanic or Latino Population in Houma, LA?
Top Zip Codes with the Highest Percentage of Hispanic or Latino Population in Houma, LA are:
What zip code has the Highest Percentage of Hispanic or Latino Population in Houma, LA?
70364 has the Highest Percentage of Hispanic or Latino Population in Houma, LA with 8.3%.
What is the Percentage of Hispanic or Latino Population in Houma, LA?
Percentage of Hispanic or Latino Population in Houma is 4.2%.
What is the Percentage of Hispanic or Latino Population in Louisiana?
Percentage of Hispanic or Latino Population in Louisiana is 5.5%.
What is the Percentage of Hispanic or Latino Population in the United States?
Percentage of Hispanic or Latino Population in the United States is 18.7%.