Zip Codes with the Highest Percentage of White / Caucasian Population in Denham Springs, LA
RELATED REPORTS & OPTIONS
White / Caucasian
Denham Springs
Compare Zip Codes
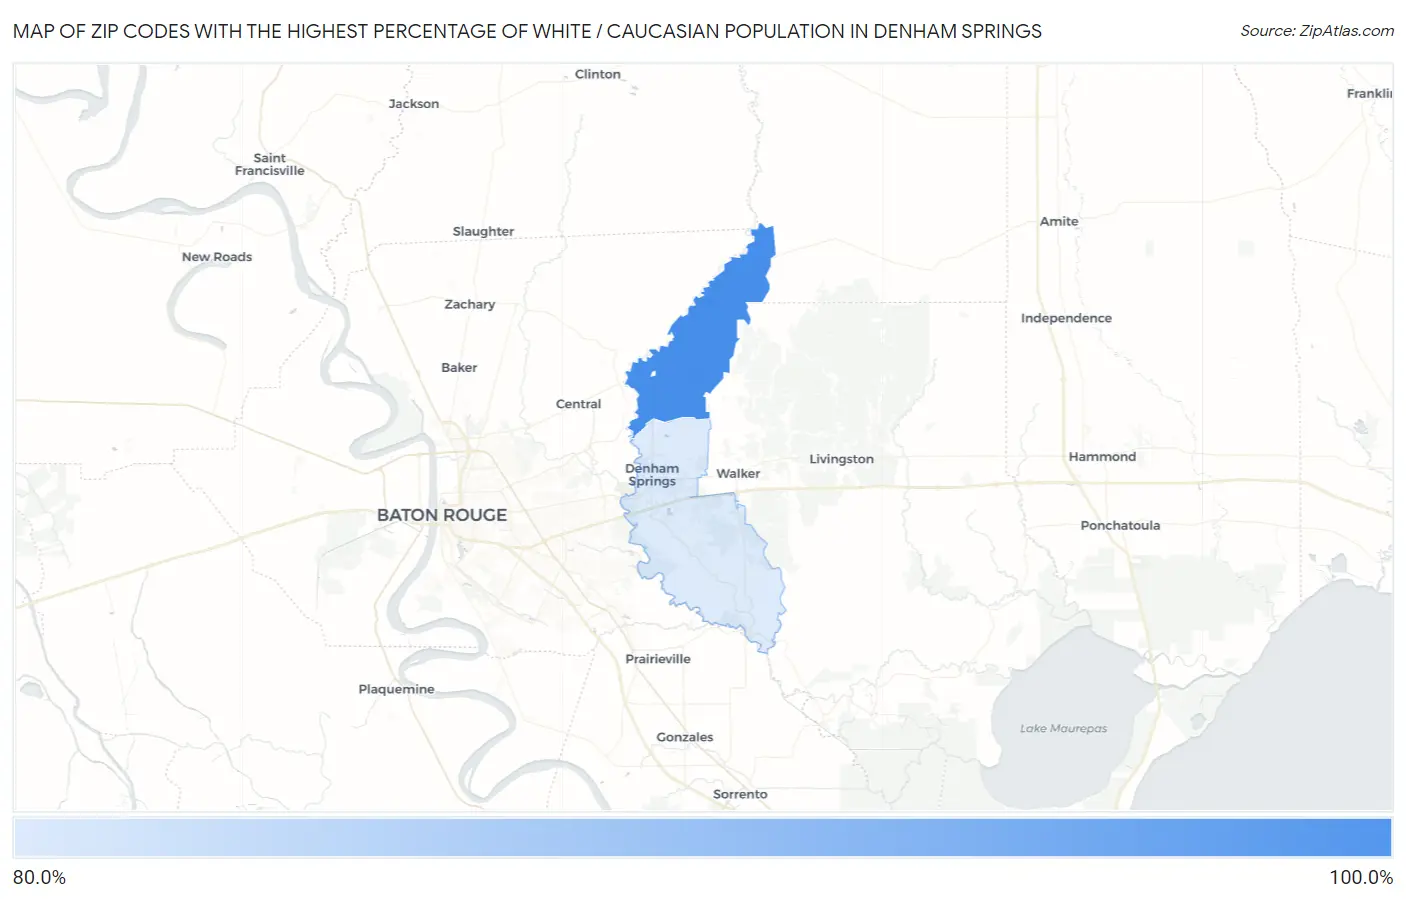
Map of Zip Codes with the Highest Percentage of White / Caucasian Population in Denham Springs
80.3%
90.3%
Zip Codes with the Highest Percentage of White / Caucasian Population in Denham Springs, LA
| Zip Code | White / Caucasian | vs State | vs National | |
| 1. | 70706 | 90.3% | 59.4%(+30.9)#104 | 65.9%(+24.4)#14,646 |
| 2. | 70726 | 80.3% | 59.4%(+20.9)#169 | 65.9%(+14.4)#20,867 |
1
Common Questions
What are the Top Zip Codes with the Highest Percentage of White / Caucasian Population in Denham Springs, LA?
Top Zip Codes with the Highest Percentage of White / Caucasian Population in Denham Springs, LA are:
What zip code has the Highest Percentage of White / Caucasian Population in Denham Springs, LA?
70706 has the Highest Percentage of White / Caucasian Population in Denham Springs, LA with 90.3%.
What is the Percentage of White / Caucasian Population in Denham Springs, LA?
Percentage of White / Caucasian Population in Denham Springs is 77.2%.
What is the Percentage of White / Caucasian Population in Louisiana?
Percentage of White / Caucasian Population in Louisiana is 59.4%.
What is the Percentage of White / Caucasian Population in the United States?
Percentage of White / Caucasian Population in the United States is 65.9%.