Zip Codes with the Highest Percentage of Self-Employed / Incorporated in Denham Springs, LA
RELATED REPORTS & OPTIONS
Self-Employed / Incorporated
Denham Springs
Compare Zip Codes
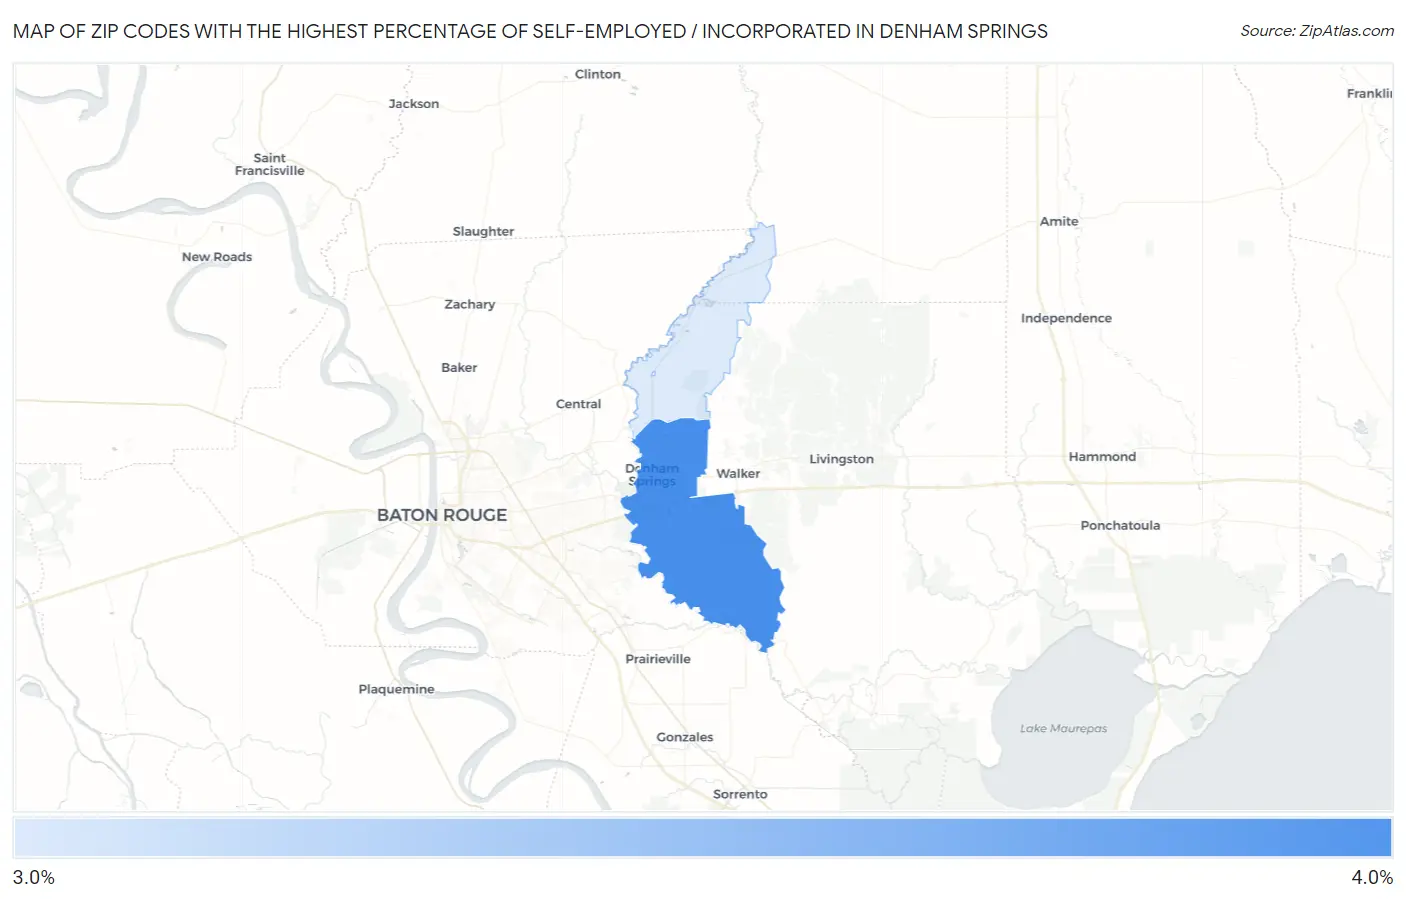
Map of Zip Codes with the Highest Percentage of Self-Employed / Incorporated in Denham Springs
3.5%
3.7%
Zip Codes with the Highest Percentage of Self-Employed / Incorporated in Denham Springs, LA
| Zip Code | % Self-Employed / Incorporated | vs State | vs National | |
| 1. | 70726 | 3.7% | 3.9%(-0.159)#194 | 3.8%(-0.123)#13,218 |
| 2. | 70706 | 3.5% | 3.9%(-0.351)#207 | 3.8%(-0.315)#14,015 |
1
Common Questions
What are the Top Zip Codes with the Highest Percentage of Self-Employed / Incorporated in Denham Springs, LA?
Top Zip Codes with the Highest Percentage of Self-Employed / Incorporated in Denham Springs, LA are:
What zip code has the Highest Percentage of Self-Employed / Incorporated in Denham Springs, LA?
70726 has the Highest Percentage of Self-Employed / Incorporated in Denham Springs, LA with 3.7%.
What is the Percentage of Self-Employed / Incorporated in Denham Springs, LA?
Percentage of Self-Employed / Incorporated in Denham Springs is 2.2%.
What is the Percentage of Self-Employed / Incorporated in Louisiana?
Percentage of Self-Employed / Incorporated in Louisiana is 3.9%.
What is the Percentage of Self-Employed / Incorporated in the United States?
Percentage of Self-Employed / Incorporated in the United States is 3.8%.