Zip Codes with the Highest Percentage of Population Employed in Agriculture, Fishing & Hunting in Denham Springs, LA
RELATED REPORTS & OPTIONS
Agriculture, Fishing & Hunting
Denham Springs
Compare Zip Codes
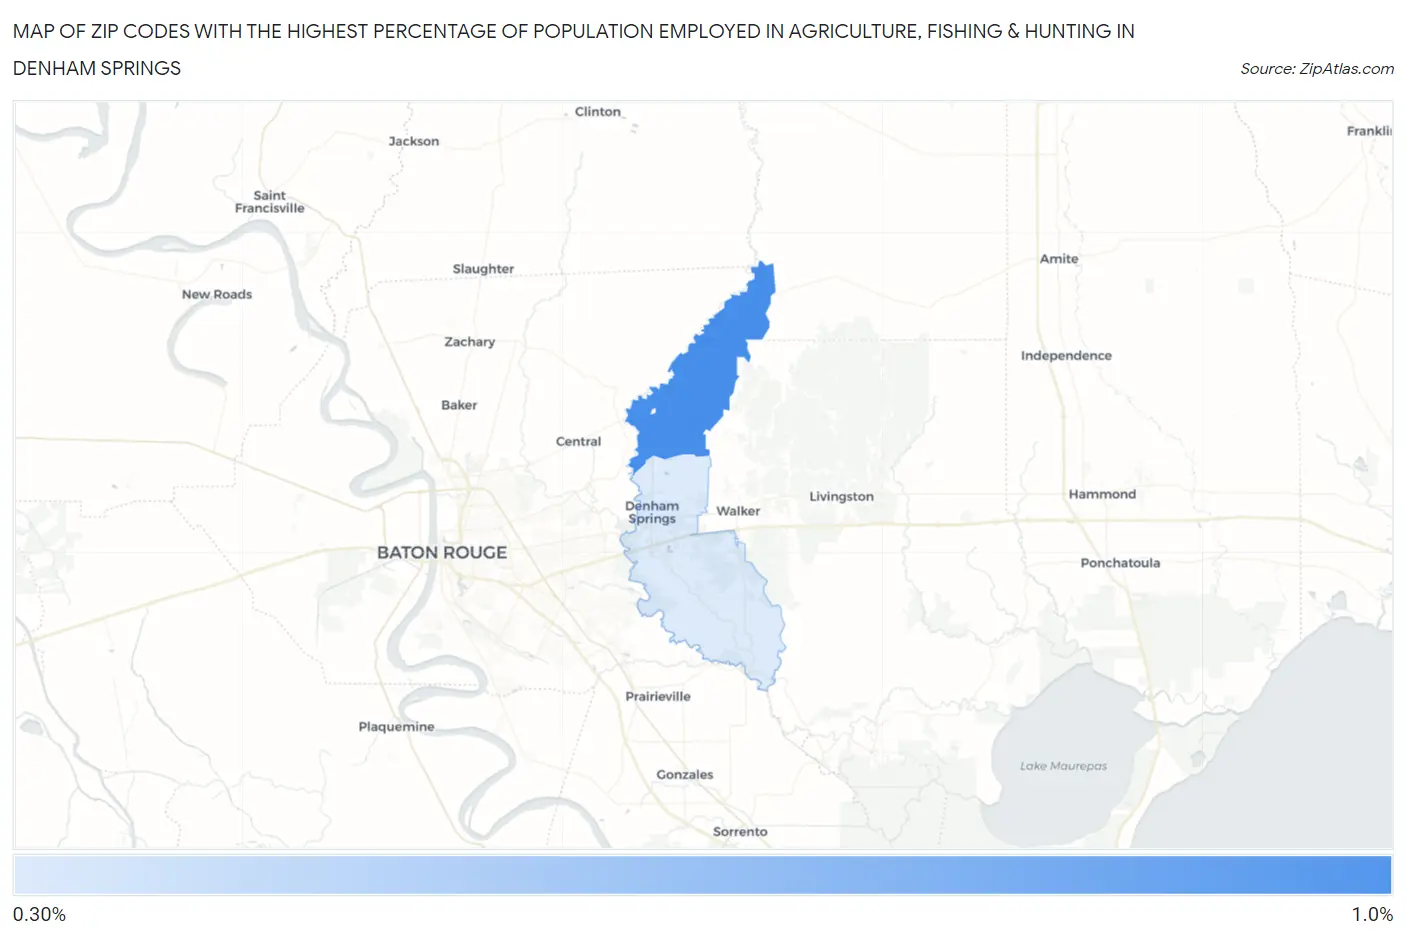
Map of Zip Codes with the Highest Percentage of Population Employed in Agriculture, Fishing & Hunting in Denham Springs
0.0%
1.0%
Zip Codes with the Highest Percentage of Population Employed in Agriculture, Fishing & Hunting in Denham Springs, LA
| Zip Code | % Employed | vs State | vs National | |
| 1. | 70706 | 0.82% | 1.0%(-0.192)#230 | 1.2%(-0.382)#17,149 |
| 2. | 70726 | 0.31% | 1.0%(-0.695)#300 | 1.2%(-0.885)#21,015 |
1
Common Questions
What are the Top Zip Codes with the Highest Percentage of Population Employed in Agriculture, Fishing & Hunting in Denham Springs, LA?
Top Zip Codes with the Highest Percentage of Population Employed in Agriculture, Fishing & Hunting in Denham Springs, LA are:
What zip code has the Highest Percentage of Population Employed in Agriculture, Fishing & Hunting in Denham Springs, LA?
70706 has the Highest Percentage of Population Employed in Agriculture, Fishing & Hunting in Denham Springs, LA with 0.82%.
What is the Percentage of Population Employed in Agriculture, Fishing & Hunting in Denham Springs, LA?
Percentage of Population Employed in Agriculture, Fishing & Hunting in Denham Springs is 0.16%.
What is the Percentage of Population Employed in Agriculture, Fishing & Hunting in Louisiana?
Percentage of Population Employed in Agriculture, Fishing & Hunting in Louisiana is 1.0%.
What is the Percentage of Population Employed in Agriculture, Fishing & Hunting in the United States?
Percentage of Population Employed in Agriculture, Fishing & Hunting in the United States is 1.2%.