Zip Codes with the Highest Percentage of Owner-Occupied Units in Denham Springs, LA
RELATED REPORTS & OPTIONS
Highest Owner-Occupied
Denham Springs
Compare Zip Codes
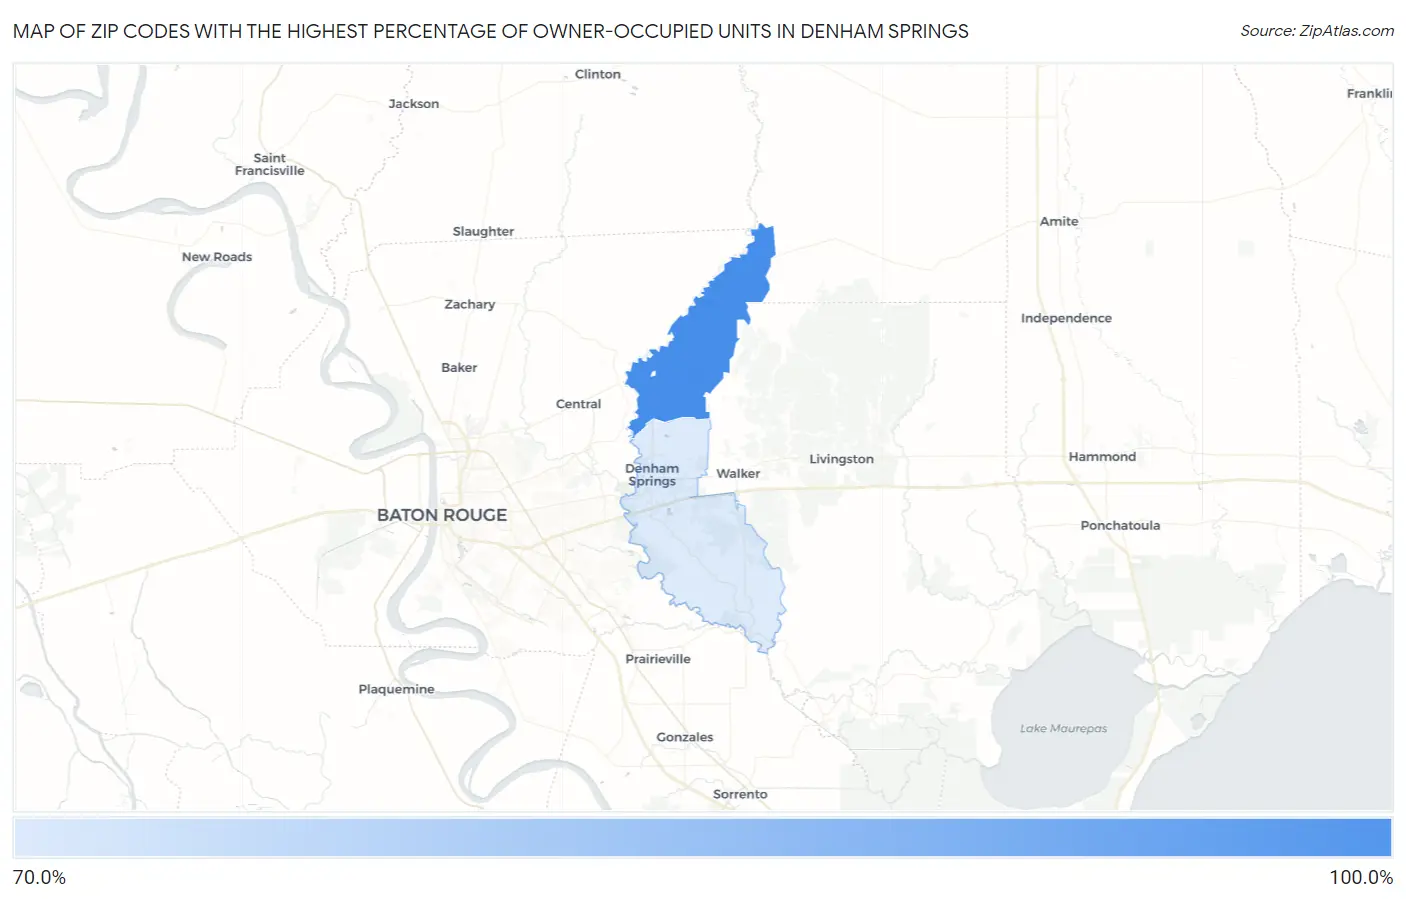
Map of Zip Codes with the Highest Percentage of Owner-Occupied Units in Denham Springs
0.0%
100.0%
Zip Codes with the Highest Percentage of Owner-Occupied Units in Denham Springs, LA
| Zip Code | % Owner-Occupied | vs State | vs National | |
| 1. | 70706 | 89.5% | 67.2%(+22.3)#86 | 64.8%(+24.7)#5,884 |
| 2. | 70726 | 76.3% | 67.2%(+9.13)#258 | 64.8%(+11.5)#18,031 |
1
Common Questions
What are the Top Zip Codes with the Highest Percentage of Owner-Occupied Units in Denham Springs, LA?
Top Zip Codes with the Highest Percentage of Owner-Occupied Units in Denham Springs, LA are:
What zip code has the Highest Percentage of Owner-Occupied Units in Denham Springs, LA?
70706 has the Highest Percentage of Owner-Occupied Units in Denham Springs, LA with 89.5%.
What is the Percentage of Owner-Occupied Units in Denham Springs, LA?
Percentage of Owner-Occupied Units in Denham Springs is 71.4%.
What is the Percentage of Owner-Occupied Units in Louisiana?
Percentage of Owner-Occupied Units in Louisiana is 67.2%.
What is the Percentage of Owner-Occupied Units in the United States?
Percentage of Owner-Occupied Units in the United States is 64.8%.