Zip Codes with the Highest Percentage of Population Employed in Farming, Fishing & Forestry in Denham Springs, LA
RELATED REPORTS & OPTIONS
Farming, Fishing & Forestry
Denham Springs
Compare Zip Codes
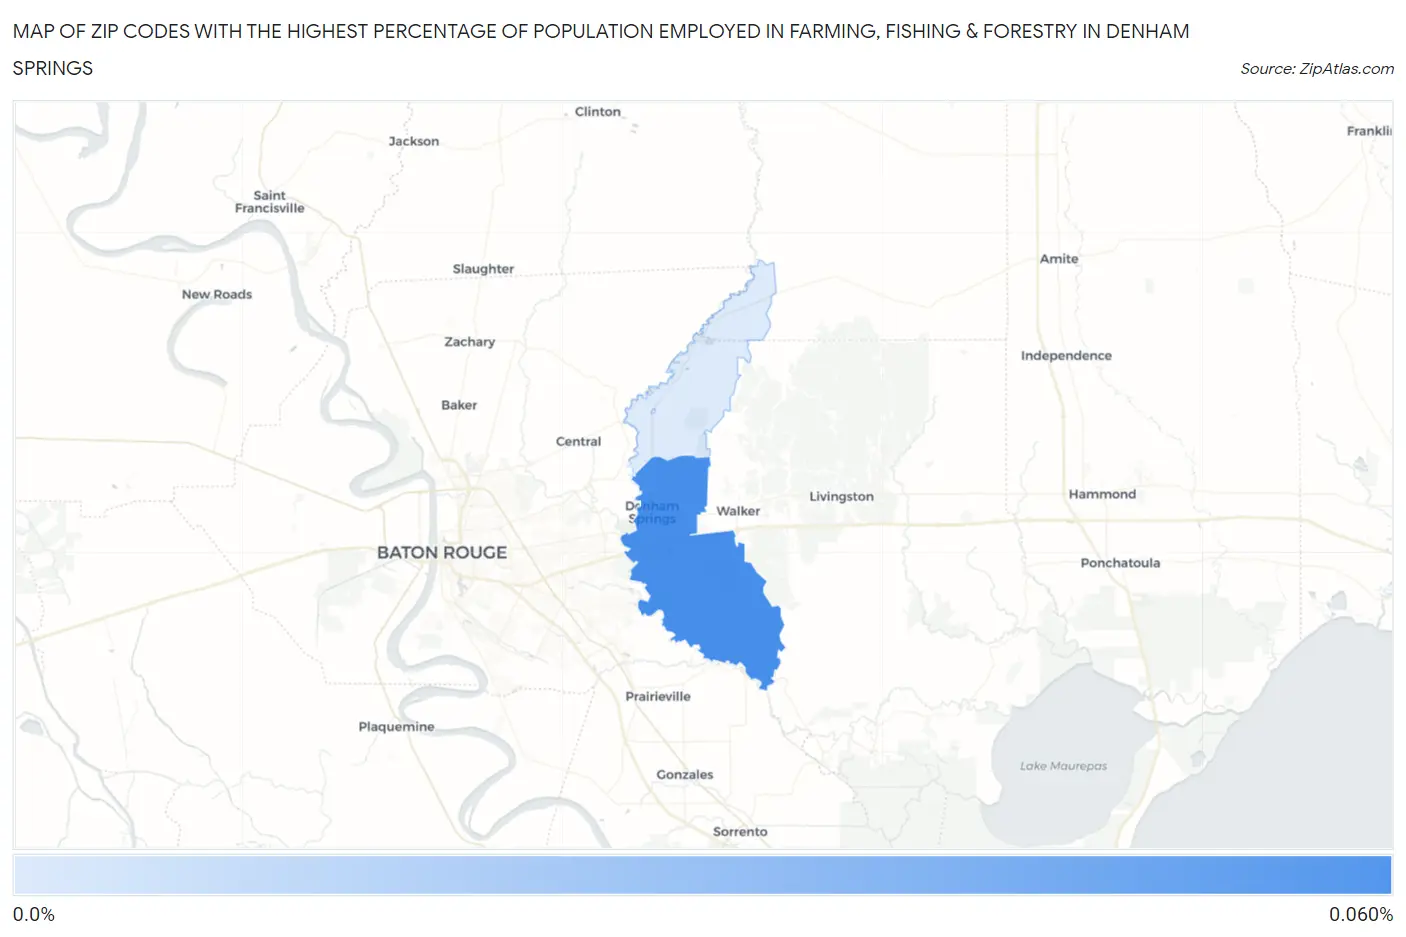
Map of Zip Codes with the Highest Percentage of Population Employed in Farming, Fishing & Forestry in Denham Springs
0.0%
0.060%
Zip Codes with the Highest Percentage of Population Employed in Farming, Fishing & Forestry in Denham Springs, LA
| Zip Code | % Employed | vs State | vs National | |
| 1. | 70726 | 0.058% | 0.50%(-0.442)#253 | 0.61%(-0.548)#18,516 |
| 2. | 70706 | 0.0094% | 0.50%(-0.491)#263 | 0.61%(-0.596)#19,166 |
1
Common Questions
What are the Top Zip Codes with the Highest Percentage of Population Employed in Farming, Fishing & Forestry in Denham Springs, LA?
Top Zip Codes with the Highest Percentage of Population Employed in Farming, Fishing & Forestry in Denham Springs, LA are:
What zip code has the Highest Percentage of Population Employed in Farming, Fishing & Forestry in Denham Springs, LA?
70726 has the Highest Percentage of Population Employed in Farming, Fishing & Forestry in Denham Springs, LA with 0.058%.
What is the Percentage of Population Employed in Farming, Fishing & Forestry in Louisiana?
Percentage of Population Employed in Farming, Fishing & Forestry in Louisiana is 0.50%.
What is the Percentage of Population Employed in Farming, Fishing & Forestry in the United States?
Percentage of Population Employed in Farming, Fishing & Forestry in the United States is 0.61%.