Zip Codes with the Highest Percentage of Black / African American Population in Denham Springs, LA
RELATED REPORTS & OPTIONS
Black / African American
Denham Springs
Compare Zip Codes
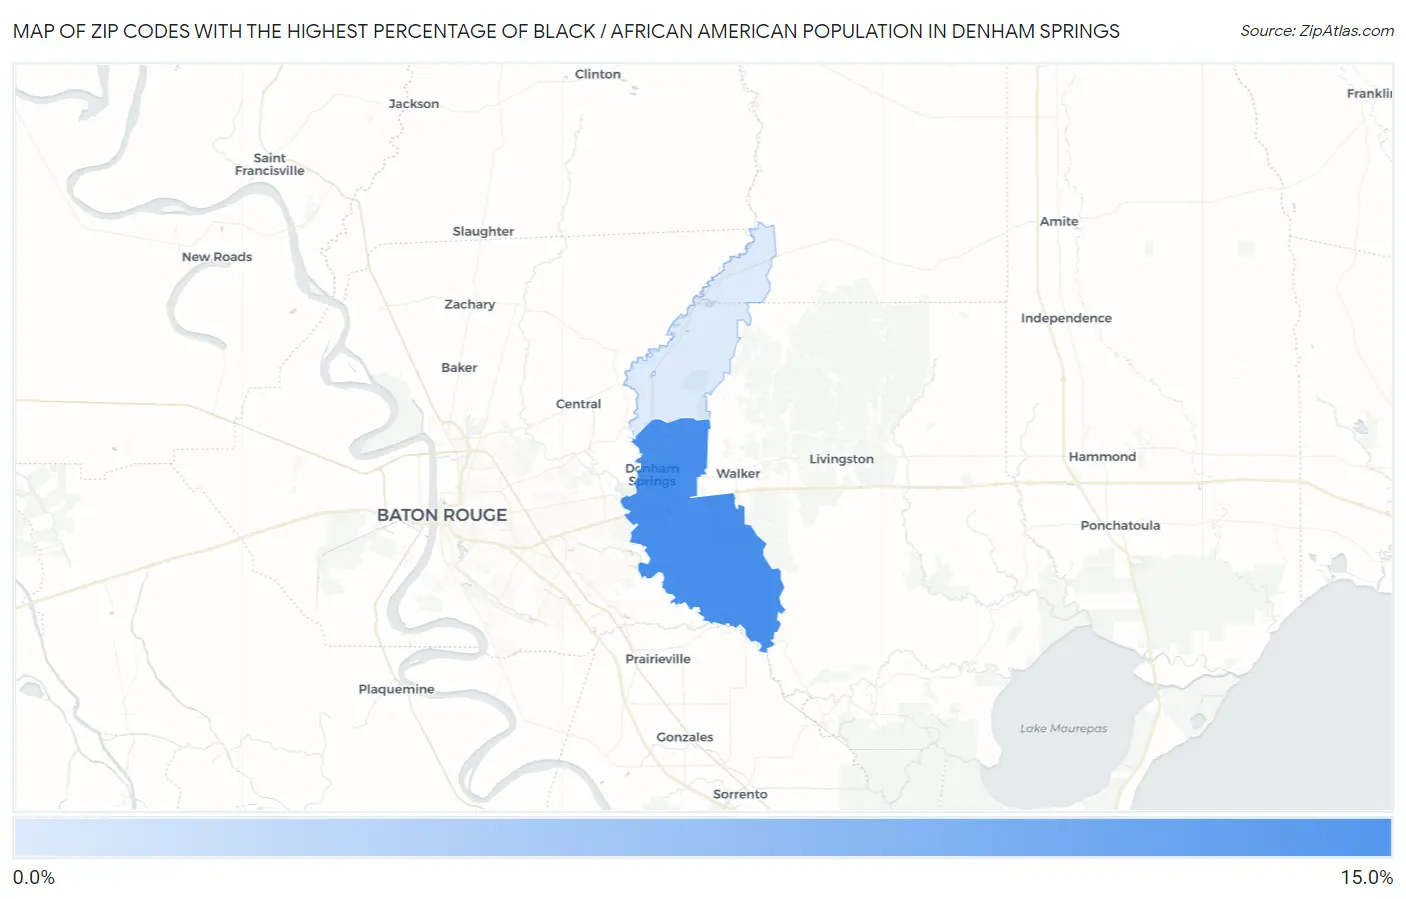
Map of Zip Codes with the Highest Percentage of Black / African American Population in Denham Springs
4.6%
12.1%
Zip Codes with the Highest Percentage of Black / African American Population in Denham Springs, LA
| Zip Code | Black / African American | vs State | vs National | |
| 1. | 70726 | 12.1% | 31.6%(-19.4)#339 | 12.5%(-0.322)#5,822 |
| 2. | 70706 | 4.6% | 31.6%(-26.9)#396 | 12.5%(-7.84)#9,894 |
1
Common Questions
What are the Top Zip Codes with the Highest Percentage of Black / African American Population in Denham Springs, LA?
Top Zip Codes with the Highest Percentage of Black / African American Population in Denham Springs, LA are:
What zip code has the Highest Percentage of Black / African American Population in Denham Springs, LA?
70726 has the Highest Percentage of Black / African American Population in Denham Springs, LA with 12.1%.
What is the Percentage of Black / African American Population in Denham Springs, LA?
Percentage of Black / African American Population in Denham Springs is 12.7%.
What is the Percentage of Black / African American Population in Louisiana?
Percentage of Black / African American Population in Louisiana is 31.6%.
What is the Percentage of Black / African American Population in the United States?
Percentage of Black / African American Population in the United States is 12.5%.