Zip Codes with the Highest Percentage of Self-Employed / Incorporated in Baton Rouge, LA
RELATED REPORTS & OPTIONS
Self-Employed / Incorporated
Baton Rouge
Compare Zip Codes
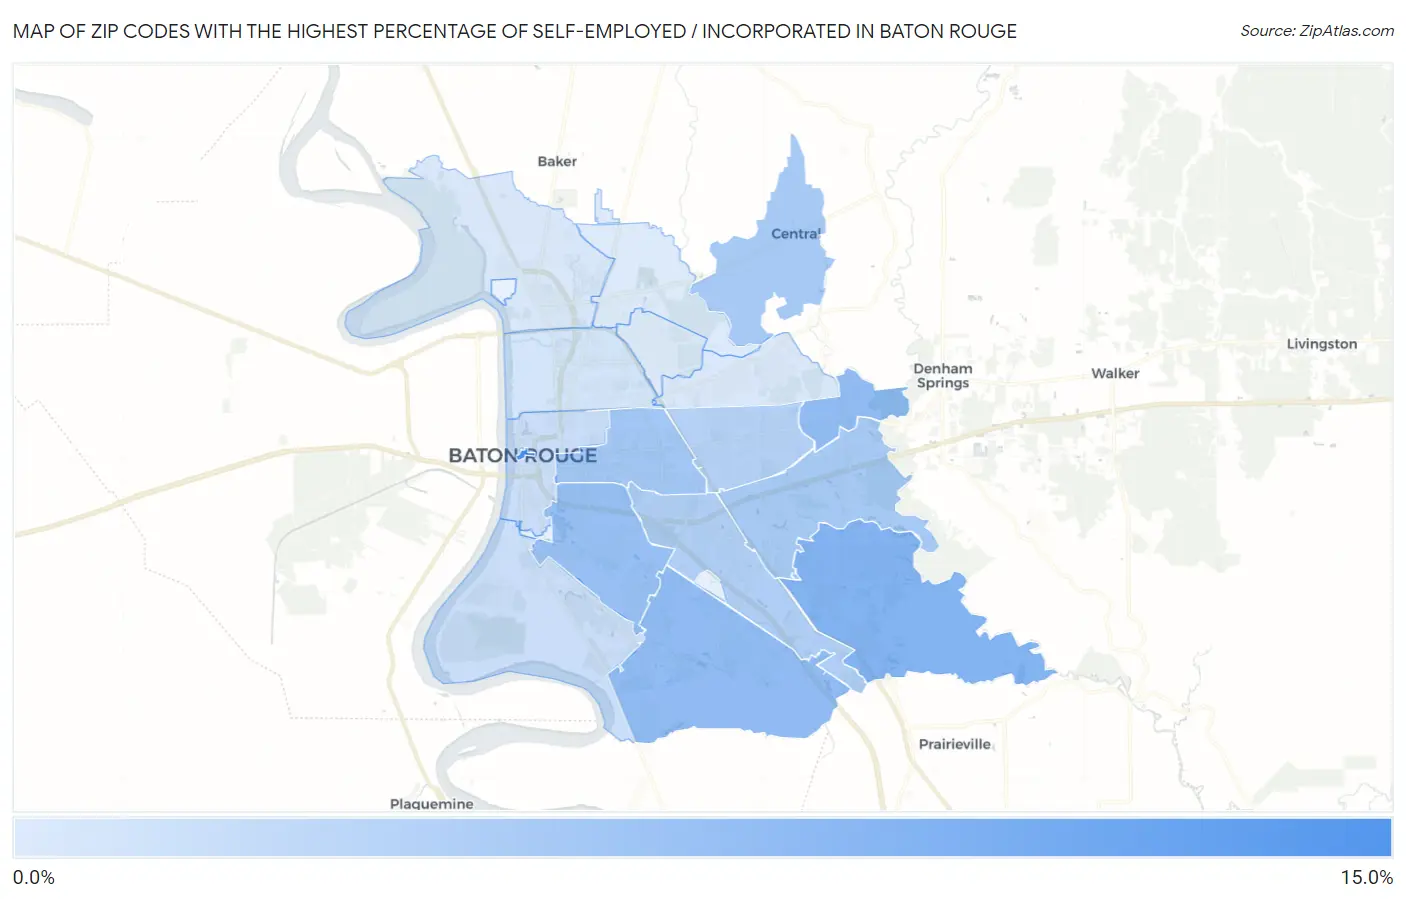
Map of Zip Codes with the Highest Percentage of Self-Employed / Incorporated in Baton Rouge
0.23%
11.3%
Zip Codes with the Highest Percentage of Self-Employed / Incorporated in Baton Rouge, LA
| Zip Code | % Self-Employed / Incorporated | vs State | vs National | |
| 1. | 70801 | 11.3% | 3.9%(+7.48)#21 | 3.8%(+7.51)#1,765 |
| 2. | 70817 | 6.7% | 3.9%(+2.85)#64 | 3.8%(+2.89)#5,171 |
| 3. | 70819 | 5.7% | 3.9%(+1.85)#99 | 3.8%(+1.89)#6,882 |
| 4. | 70810 | 5.7% | 3.9%(+1.81)#102 | 3.8%(+1.84)#6,982 |
| 5. | 70808 | 5.3% | 3.9%(+1.41)#110 | 3.8%(+1.45)#7,903 |
| 6. | 70806 | 4.3% | 3.9%(+0.480)#150 | 3.8%(+0.516)#10,697 |
| 7. | 70818 | 4.1% | 3.9%(+0.204)#166 | 3.8%(+0.239)#11,694 |
| 8. | 70816 | 4.0% | 3.9%(+0.101)#174 | 3.8%(+0.137)#12,113 |
| 9. | 70809 | 3.4% | 3.9%(-0.467)#212 | 3.8%(-0.432)#14,559 |
| 10. | 70815 | 3.1% | 3.9%(-0.786)#238 | 3.8%(-0.750)#16,051 |
| 11. | 70802 | 1.6% | 3.9%(-2.24)#339 | 3.8%(-2.21)#23,040 |
| 12. | 70820 | 1.6% | 3.9%(-2.25)#340 | 3.8%(-2.22)#23,090 |
| 13. | 70805 | 0.84% | 3.9%(-3.01)#384 | 3.8%(-2.98)#25,717 |
| 14. | 70807 | 0.51% | 3.9%(-3.34)#397 | 3.8%(-3.31)#26,477 |
| 15. | 70814 | 0.41% | 3.9%(-3.44)#400 | 3.8%(-3.41)#26,644 |
| 16. | 70812 | 0.29% | 3.9%(-3.56)#401 | 3.8%(-3.52)#26,800 |
| 17. | 70811 | 0.23% | 3.9%(-3.63)#405 | 3.8%(-3.59)#26,864 |
1
Common Questions
What are the Top 10 Zip Codes with the Highest Percentage of Self-Employed / Incorporated in Baton Rouge, LA?
Top 10 Zip Codes with the Highest Percentage of Self-Employed / Incorporated in Baton Rouge, LA are:
What zip code has the Highest Percentage of Self-Employed / Incorporated in Baton Rouge, LA?
70801 has the Highest Percentage of Self-Employed / Incorporated in Baton Rouge, LA with 11.3%.
What is the Percentage of Self-Employed / Incorporated in Baton Rouge, LA?
Percentage of Self-Employed / Incorporated in Baton Rouge is 3.1%.
What is the Percentage of Self-Employed / Incorporated in Louisiana?
Percentage of Self-Employed / Incorporated in Louisiana is 3.9%.
What is the Percentage of Self-Employed / Incorporated in the United States?
Percentage of Self-Employed / Incorporated in the United States is 3.8%.