Zip Codes with the Highest Percentage of Population Employed in Agriculture, Fishing & Hunting in Owensboro, KY
RELATED REPORTS & OPTIONS
Agriculture, Fishing & Hunting
Owensboro
Compare Zip Codes
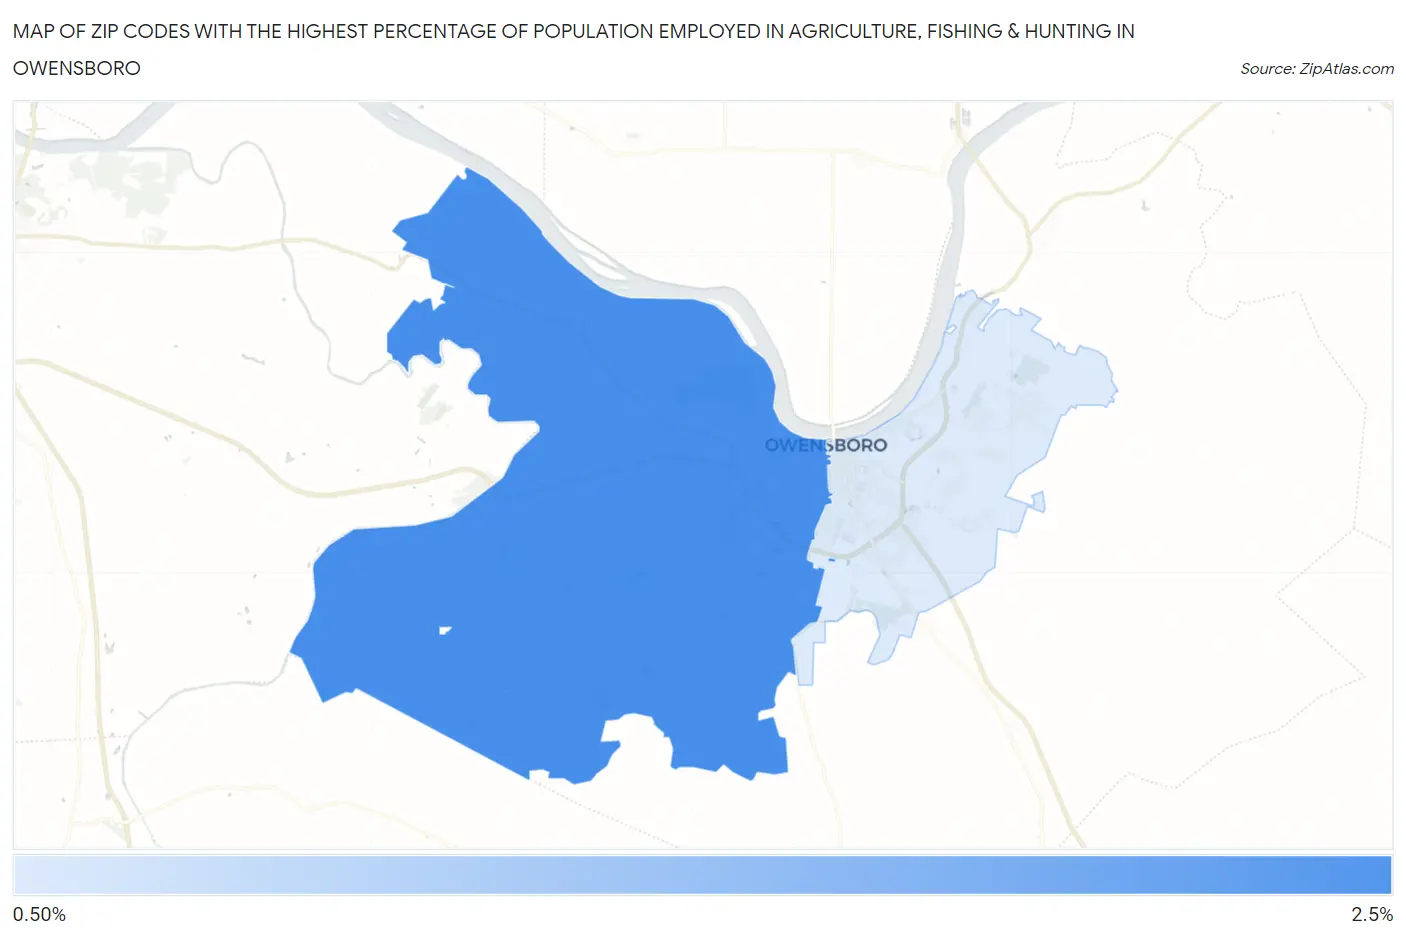
Map of Zip Codes with the Highest Percentage of Population Employed in Agriculture, Fishing & Hunting in Owensboro
0.0%
2.5%
Zip Codes with the Highest Percentage of Population Employed in Agriculture, Fishing & Hunting in Owensboro, KY
| Zip Code | % Employed | vs State | vs National | |
| 1. | 42301 | 2.3% | 1.3%(+1.03)#174 | 1.2%(+1.14)#11,934 |
| 2. | 42303 | 0.63% | 1.3%(-0.683)#317 | 1.2%(-0.568)#18,261 |
1
Common Questions
What are the Top Zip Codes with the Highest Percentage of Population Employed in Agriculture, Fishing & Hunting in Owensboro, KY?
Top Zip Codes with the Highest Percentage of Population Employed in Agriculture, Fishing & Hunting in Owensboro, KY are:
What zip code has the Highest Percentage of Population Employed in Agriculture, Fishing & Hunting in Owensboro, KY?
42301 has the Highest Percentage of Population Employed in Agriculture, Fishing & Hunting in Owensboro, KY with 2.3%.
What is the Percentage of Population Employed in Agriculture, Fishing & Hunting in Owensboro, KY?
Percentage of Population Employed in Agriculture, Fishing & Hunting in Owensboro is 0.70%.
What is the Percentage of Population Employed in Agriculture, Fishing & Hunting in Kentucky?
Percentage of Population Employed in Agriculture, Fishing & Hunting in Kentucky is 1.3%.
What is the Percentage of Population Employed in Agriculture, Fishing & Hunting in the United States?
Percentage of Population Employed in Agriculture, Fishing & Hunting in the United States is 1.2%.