Zip Codes with the Highest Percentage of Population Employed in Agriculture, Fishing & Hunting in Newport, KY
RELATED REPORTS & OPTIONS
Agriculture, Fishing & Hunting
Newport
Compare Zip Codes
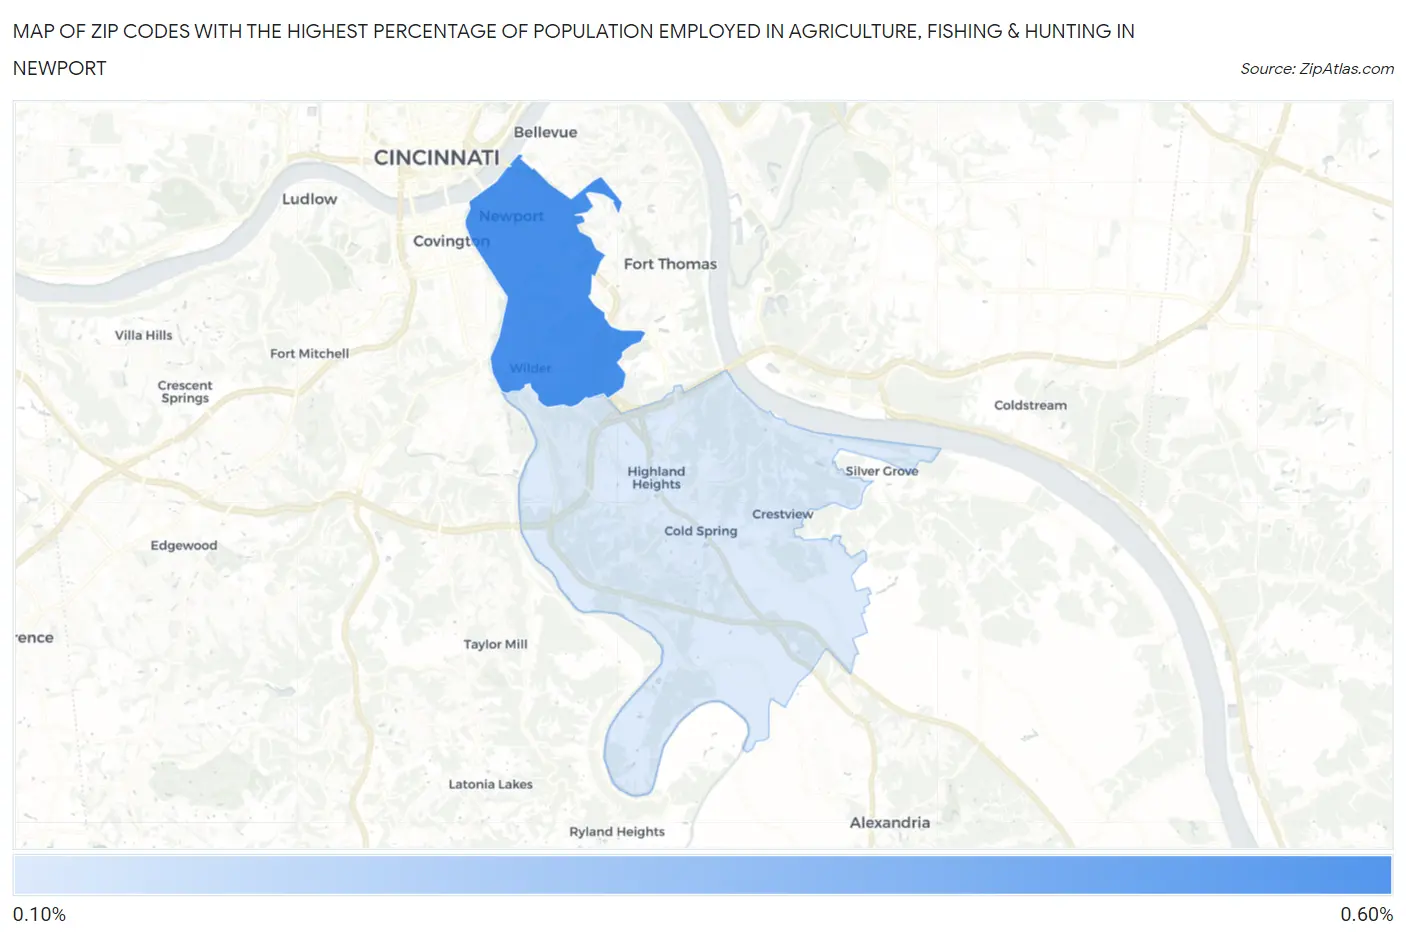
Map of Zip Codes with the Highest Percentage of Population Employed in Agriculture, Fishing & Hunting in Newport
0.0%
0.60%
Zip Codes with the Highest Percentage of Population Employed in Agriculture, Fishing & Hunting in Newport, KY
| Zip Code | % Employed | vs State | vs National | |
| 1. | 41071 | 0.54% | 1.3%(-0.775)#327 | 1.2%(-0.660)#18,936 |
| 2. | 41076 | 0.19% | 1.3%(-1.12)#377 | 1.2%(-1.01)#22,455 |
1
Common Questions
What are the Top Zip Codes with the Highest Percentage of Population Employed in Agriculture, Fishing & Hunting in Newport, KY?
Top Zip Codes with the Highest Percentage of Population Employed in Agriculture, Fishing & Hunting in Newport, KY are:
What zip code has the Highest Percentage of Population Employed in Agriculture, Fishing & Hunting in Newport, KY?
41071 has the Highest Percentage of Population Employed in Agriculture, Fishing & Hunting in Newport, KY with 0.54%.
What is the Percentage of Population Employed in Agriculture, Fishing & Hunting in Newport, KY?
Percentage of Population Employed in Agriculture, Fishing & Hunting in Newport is 0.69%.
What is the Percentage of Population Employed in Agriculture, Fishing & Hunting in Kentucky?
Percentage of Population Employed in Agriculture, Fishing & Hunting in Kentucky is 1.3%.
What is the Percentage of Population Employed in Agriculture, Fishing & Hunting in the United States?
Percentage of Population Employed in Agriculture, Fishing & Hunting in the United States is 1.2%.