Zip Codes with the Highest Percentage of Population Employed in Farming, Fishing & Forestry in Newport, KY
RELATED REPORTS & OPTIONS
Farming, Fishing & Forestry
Newport
Compare Zip Codes
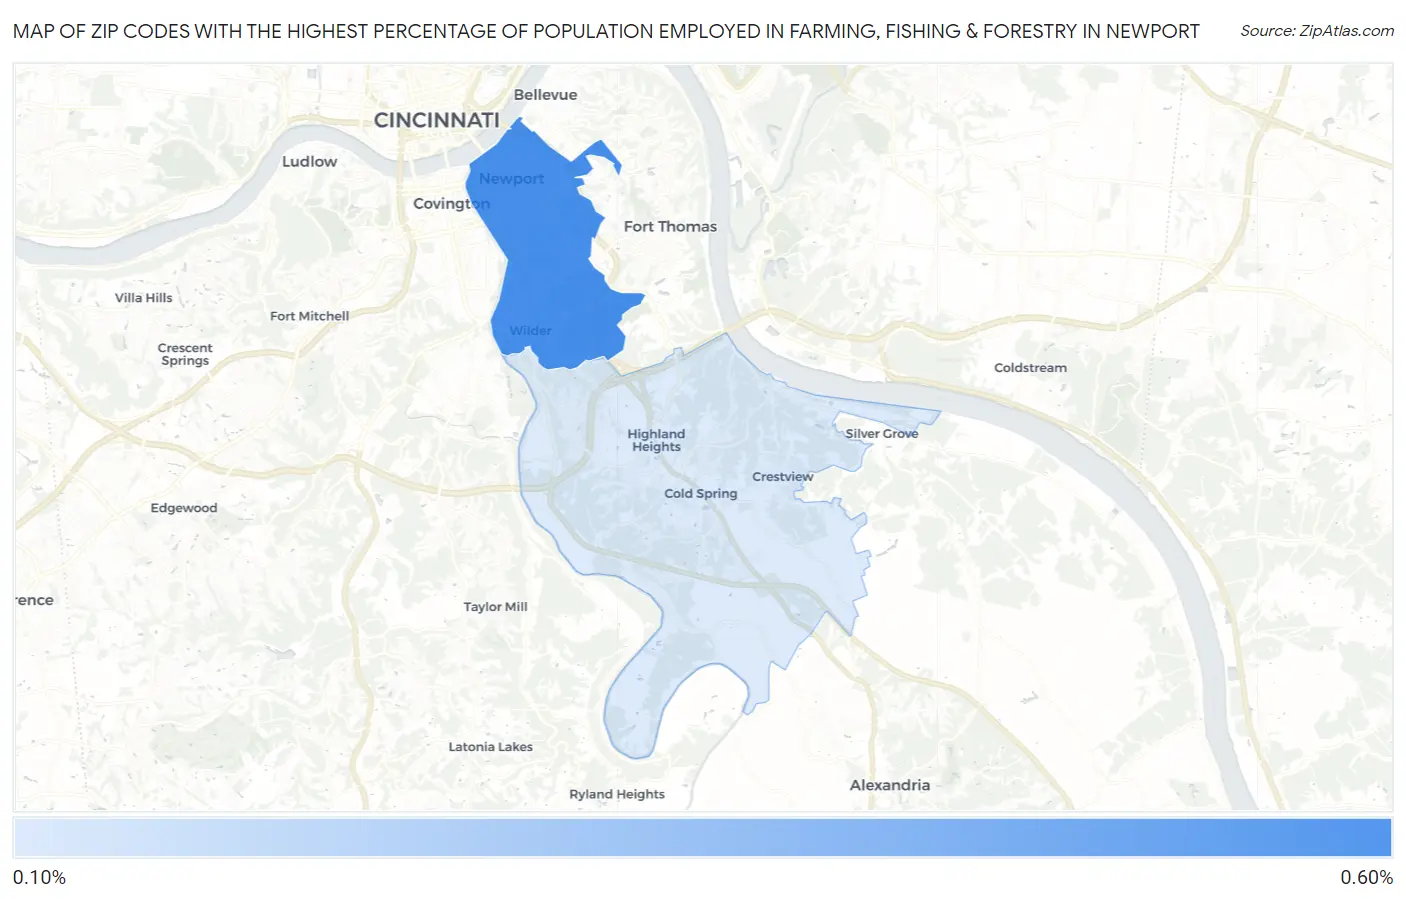
Map of Zip Codes with the Highest Percentage of Population Employed in Farming, Fishing & Forestry in Newport
0.0%
0.60%
Zip Codes with the Highest Percentage of Population Employed in Farming, Fishing & Forestry in Newport, KY
| Zip Code | % Employed | vs State | vs National | |
| 1. | 41071 | 0.54% | 0.52%(+0.023)#198 | 0.61%(-0.066)#12,522 |
| 2. | 41076 | 0.19% | 0.52%(-0.325)#253 | 0.61%(-0.414)#16,248 |
1
Common Questions
What are the Top Zip Codes with the Highest Percentage of Population Employed in Farming, Fishing & Forestry in Newport, KY?
Top Zip Codes with the Highest Percentage of Population Employed in Farming, Fishing & Forestry in Newport, KY are:
What zip code has the Highest Percentage of Population Employed in Farming, Fishing & Forestry in Newport, KY?
41071 has the Highest Percentage of Population Employed in Farming, Fishing & Forestry in Newport, KY with 0.54%.
What is the Percentage of Population Employed in Farming, Fishing & Forestry in Newport, KY?
Percentage of Population Employed in Farming, Fishing & Forestry in Newport is 0.69%.
What is the Percentage of Population Employed in Farming, Fishing & Forestry in Kentucky?
Percentage of Population Employed in Farming, Fishing & Forestry in Kentucky is 0.52%.
What is the Percentage of Population Employed in Farming, Fishing & Forestry in the United States?
Percentage of Population Employed in Farming, Fishing & Forestry in the United States is 0.61%.