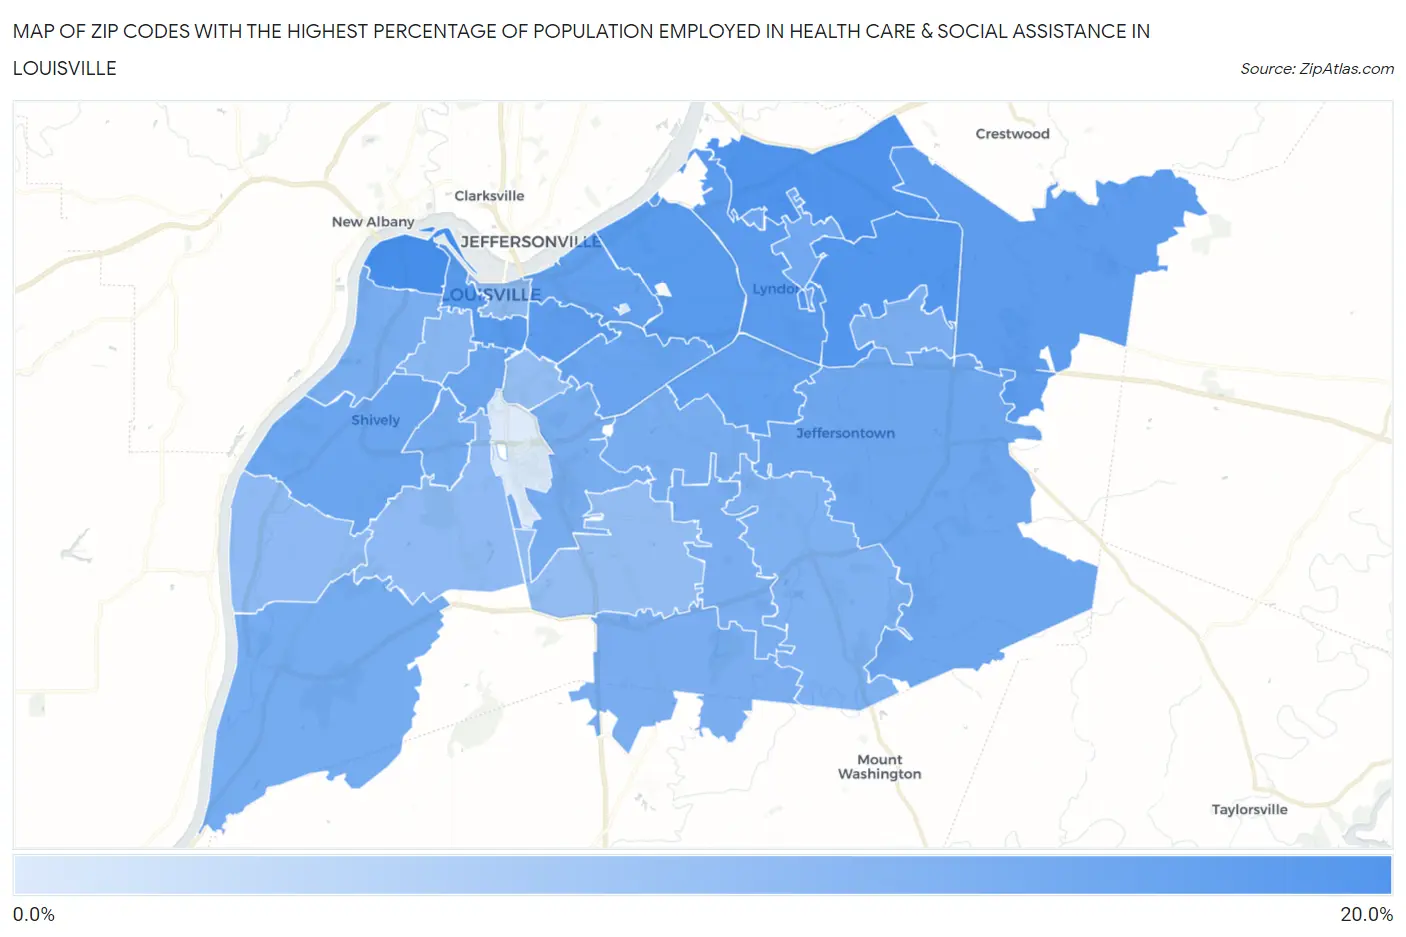
Zip Codes with the Highest Percentage of Population Employed in Health Care & Social Assistance in Louisville, KY
RELATED REPORTS & OPTIONS
Health Care & Social Assistance
Louisville
Compare Zip Codes
Map of Zip Codes with the Highest Percentage of Population Employed in Health Care & Social Assistance in Louisville
0.0%
20.0%
Zip Codes with the Highest Percentage of Population Employed in Health Care & Social Assistance in Louisville, KY
| Zip Code | % Employed | vs State | vs National | |
| 1. | 40212 | 19.1% | 14.4%(+4.61)#174 | 13.9%(+5.12)#4,933 |
| 2. | 40241 | 18.4% | 14.4%(+3.92)#188 | 13.9%(+4.43)#5,729 |
| 3. | 40223 | 17.7% | 14.4%(+3.27)#207 | 13.9%(+3.77)#6,607 |
| 4. | 40207 | 17.1% | 14.4%(+2.68)#218 | 13.9%(+3.19)#7,518 |
| 5. | 40203 | 17.1% | 14.4%(+2.63)#221 | 13.9%(+3.14)#7,605 |
| 6. | 40222 | 16.6% | 14.4%(+2.13)#243 | 13.9%(+2.64)#8,420 |
| 7. | 40245 | 16.3% | 14.4%(+1.90)#251 | 13.9%(+2.41)#8,823 |
| 8. | 40204 | 16.3% | 14.4%(+1.83)#258 | 13.9%(+2.34)#8,996 |
| 9. | 40206 | 15.8% | 14.4%(+1.35)#272 | 13.9%(+1.86)#9,913 |
| 10. | 40220 | 15.8% | 14.4%(+1.35)#273 | 13.9%(+1.85)#9,929 |
| 11. | 40205 | 15.1% | 14.4%(+0.669)#307 | 13.9%(+1.18)#11,382 |
| 12. | 40216 | 14.8% | 14.4%(+0.320)#319 | 13.9%(+0.828)#12,190 |
| 13. | 40208 | 14.6% | 14.4%(+0.195)#324 | 13.9%(+0.703)#12,511 |
| 14. | 40299 | 14.5% | 14.4%(+0.044)#339 | 13.9%(+0.552)#12,879 |
| 15. | 40242 | 14.3% | 14.4%(-0.146)#347 | 13.9%(+0.362)#13,337 |
| 16. | 40272 | 13.8% | 14.4%(-0.646)#366 | 13.9%(-0.138)#14,575 |
| 17. | 40215 | 13.6% | 14.4%(-0.834)#375 | 13.9%(-0.326)#15,015 |
| 18. | 40218 | 13.4% | 14.4%(-1.02)#387 | 13.9%(-0.509)#15,482 |
| 19. | 40211 | 13.3% | 14.4%(-1.13)#391 | 13.9%(-0.617)#15,748 |
| 20. | 40213 | 13.3% | 14.4%(-1.14)#392 | 13.9%(-0.634)#15,794 |
| 21. | 40243 | 13.3% | 14.4%(-1.17)#395 | 13.9%(-0.660)#15,851 |
| 22. | 40228 | 13.3% | 14.4%(-1.17)#396 | 13.9%(-0.667)#15,868 |
| 23. | 40229 | 13.1% | 14.4%(-1.32)#402 | 13.9%(-0.813)#16,263 |
| 24. | 40291 | 12.7% | 14.4%(-1.70)#419 | 13.9%(-1.19)#17,233 |
| 25. | 40210 | 11.6% | 14.4%(-2.86)#471 | 13.9%(-2.36)#20,008 |
| 26. | 40202 | 11.1% | 14.4%(-3.36)#493 | 13.9%(-2.85)#21,170 |
| 27. | 40214 | 10.9% | 14.4%(-3.56)#502 | 13.9%(-3.05)#21,608 |
| 28. | 40258 | 10.8% | 14.4%(-3.60)#504 | 13.9%(-3.10)#21,714 |
| 29. | 40219 | 10.3% | 14.4%(-4.19)#522 | 13.9%(-3.68)#22,913 |
| 30. | 40217 | 10.2% | 14.4%(-4.21)#525 | 13.9%(-3.70)#22,970 |
| 31. | 40280 | 2.5% | 14.4%(-11.9)#665 | 13.9%(-11.4)#30,163 |
| 32. | 40209 | 2.5% | 14.4%(-12.0)#667 | 13.9%(-11.5)#30,181 |
1
Common Questions
What are the Top 10 Zip Codes with the Highest Percentage of Population Employed in Health Care & Social Assistance in Louisville, KY?
Top 10 Zip Codes with the Highest Percentage of Population Employed in Health Care & Social Assistance in Louisville, KY are:
What zip code has the Highest Percentage of Population Employed in Health Care & Social Assistance in Louisville, KY?
40212 has the Highest Percentage of Population Employed in Health Care & Social Assistance in Louisville, KY with 19.1%.
What is the Percentage of Population Employed in Health Care & Social Assistance in Louisville, KY?
Percentage of Population Employed in Health Care & Social Assistance in Louisville is 13.8%.
What is the Percentage of Population Employed in Health Care & Social Assistance in Kentucky?
Percentage of Population Employed in Health Care & Social Assistance in Kentucky is 14.4%.
What is the Percentage of Population Employed in Health Care & Social Assistance in the United States?
Percentage of Population Employed in Health Care & Social Assistance in the United States is 13.9%.