Zip Codes with the Highest Percentage of Owner-Occupied Units in Louisville, KY
RELATED REPORTS & OPTIONS
Highest Owner-Occupied
Louisville
Compare Zip Codes
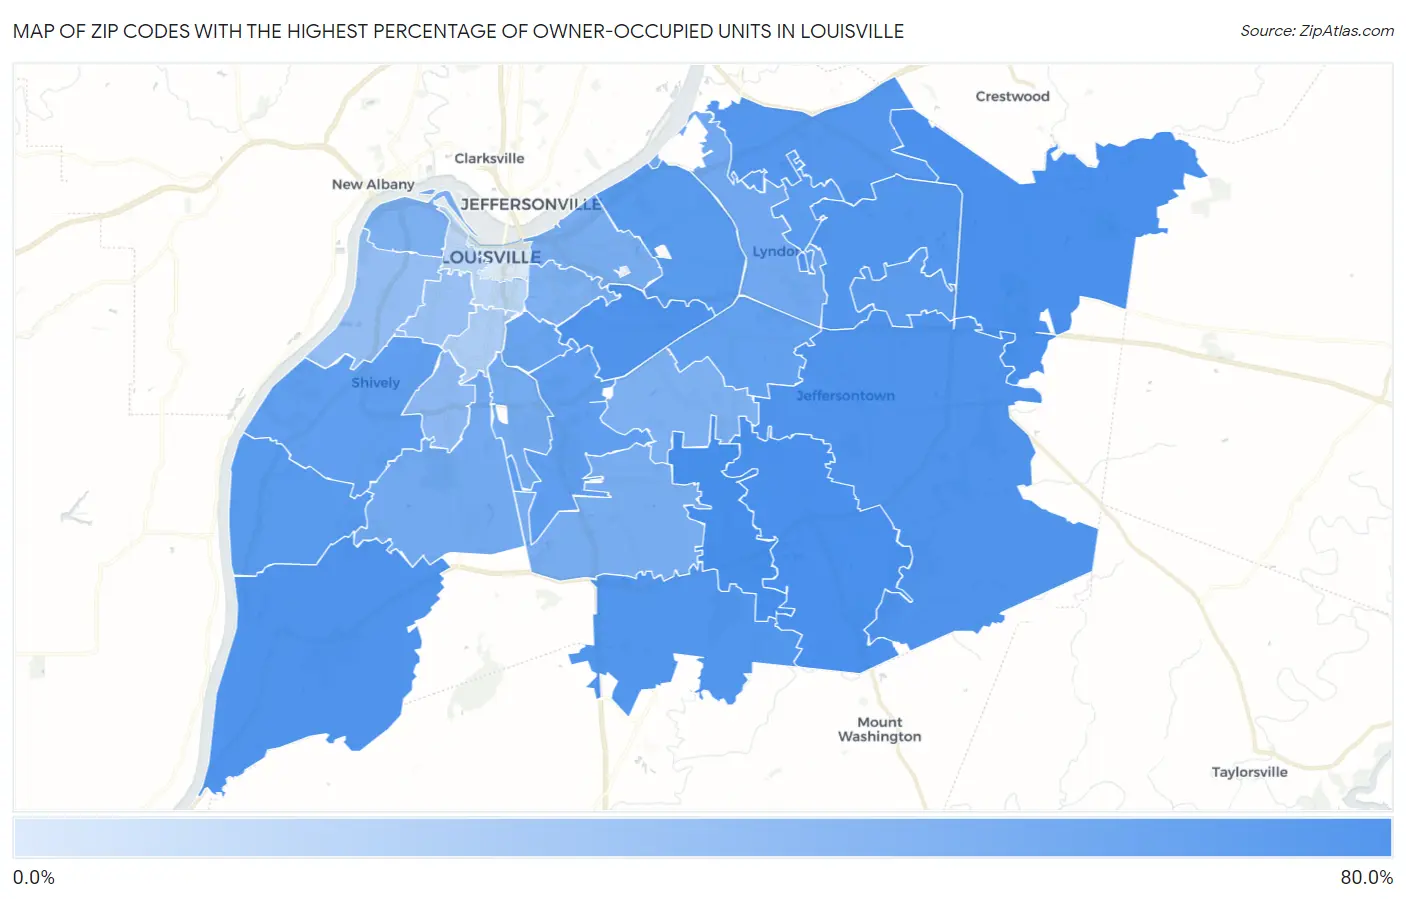
Map of Zip Codes with the Highest Percentage of Owner-Occupied Units in Louisville
0.0%
80.0%
Zip Codes with the Highest Percentage of Owner-Occupied Units in Louisville, KY
| Zip Code | % Owner-Occupied | vs State | vs National | |
| 1. | 40228 | 79.0% | 68.1%(+10.9)#367 | 64.8%(+14.2)#15,536 |
| 2. | 40245 | 78.2% | 68.1%(+10.1)#382 | 64.8%(+13.4)#16,256 |
| 3. | 40291 | 77.4% | 68.1%(+9.30)#403 | 64.8%(+12.6)#17,002 |
| 4. | 40299 | 75.6% | 68.1%(+7.47)#440 | 64.8%(+10.8)#18,663 |
| 5. | 40205 | 74.9% | 68.1%(+6.75)#460 | 64.8%(+10.1)#19,317 |
| 6. | 40272 | 73.0% | 68.1%(+4.91)#490 | 64.8%(+8.21)#20,695 |
| 7. | 40223 | 72.9% | 68.1%(+4.82)#493 | 64.8%(+8.12)#20,763 |
| 8. | 40229 | 72.6% | 68.1%(+4.49)#505 | 64.8%(+7.79)#20,988 |
| 9. | 40241 | 71.0% | 68.1%(+2.85)#538 | 64.8%(+6.15)#22,148 |
| 10. | 40207 | 69.8% | 68.1%(+1.67)#556 | 64.8%(+4.97)#22,898 |
| 11. | 40258 | 69.3% | 68.1%(+1.20)#566 | 64.8%(+4.50)#23,190 |
| 12. | 40242 | 68.9% | 68.1%(+0.759)#569 | 64.8%(+4.06)#23,448 |
| 13. | 40243 | 67.2% | 68.1%(-0.955)#593 | 64.8%(+2.35)#24,405 |
| 14. | 40213 | 64.5% | 68.1%(-3.65)#627 | 64.8%(-0.347)#25,717 |
| 15. | 40216 | 64.1% | 68.1%(-4.06)#634 | 64.8%(-0.762)#25,890 |
| 16. | 40220 | 63.1% | 68.1%(-5.06)#645 | 64.8%(-1.76)#26,310 |
| 17. | 40217 | 60.2% | 68.1%(-7.92)#667 | 64.8%(-4.62)#27,348 |
| 18. | 40222 | 55.6% | 68.1%(-12.5)#688 | 64.8%(-9.23)#28,606 |
| 19. | 40214 | 55.0% | 68.1%(-13.1)#693 | 64.8%(-9.81)#28,765 |
| 20. | 40209 | 53.8% | 68.1%(-14.4)#697 | 64.8%(-11.1)#29,041 |
| 21. | 40206 | 52.8% | 68.1%(-15.3)#703 | 64.8%(-12.0)#29,212 |
| 22. | 40219 | 52.7% | 68.1%(-15.4)#705 | 64.8%(-12.1)#29,234 |
| 23. | 40212 | 50.6% | 68.1%(-17.5)#712 | 64.8%(-14.2)#29,618 |
| 24. | 40218 | 50.1% | 68.1%(-18.0)#713 | 64.8%(-14.7)#29,708 |
| 25. | 40204 | 49.5% | 68.1%(-18.6)#714 | 64.8%(-15.3)#29,803 |
| 26. | 40215 | 42.5% | 68.1%(-25.7)#730 | 64.8%(-22.4)#30,775 |
| 27. | 40211 | 39.1% | 68.1%(-29.1)#734 | 64.8%(-25.7)#31,103 |
| 28. | 40210 | 37.2% | 68.1%(-31.0)#737 | 64.8%(-27.7)#31,257 |
| 29. | 40208 | 28.3% | 68.1%(-39.8)#742 | 64.8%(-36.5)#31,850 |
| 30. | 40203 | 22.5% | 68.1%(-45.6)#746 | 64.8%(-42.3)#32,058 |
| 31. | 40202 | 9.3% | 68.1%(-58.8)#752 | 64.8%(-55.5)#32,369 |
1
Common Questions
What are the Top 10 Zip Codes with the Highest Percentage of Owner-Occupied Units in Louisville, KY?
Top 10 Zip Codes with the Highest Percentage of Owner-Occupied Units in Louisville, KY are:
What zip code has the Highest Percentage of Owner-Occupied Units in Louisville, KY?
40228 has the Highest Percentage of Owner-Occupied Units in Louisville, KY with 79.0%.
What is the Percentage of Owner-Occupied Units in Louisville, KY?
Percentage of Owner-Occupied Units in Louisville is 60.4%.
What is the Percentage of Owner-Occupied Units in Kentucky?
Percentage of Owner-Occupied Units in Kentucky is 68.1%.
What is the Percentage of Owner-Occupied Units in the United States?
Percentage of Owner-Occupied Units in the United States is 64.8%.