Zip Codes with the Highest Percentage of Renter-Occupied Units in London, KY
RELATED REPORTS & OPTIONS
Highest Renter-Occupied
London
Compare Zip Codes
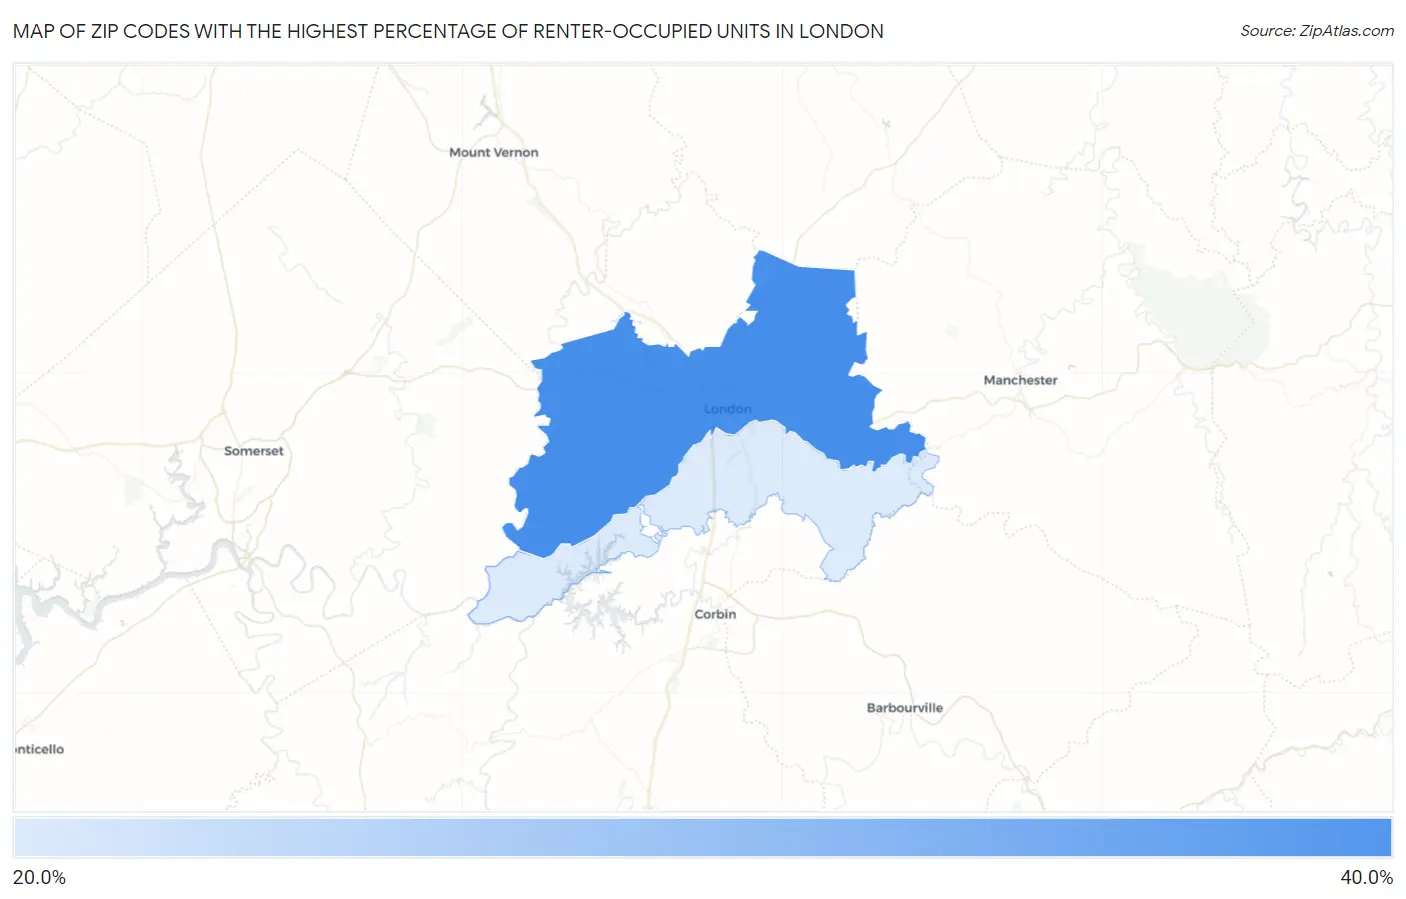
Map of Zip Codes with the Highest Percentage of Renter-Occupied Units in London
0.0%
40.0%
Zip Codes with the Highest Percentage of Renter-Occupied Units in London, KY
| Zip Code | % Renter-Occupied | vs State | vs National | |
| 1. | 40741 | 30.5% | 31.9%(-1.42)#198 | 35.2%(-4.72)#9,756 |
| 2. | 40744 | 27.5% | 31.9%(-4.36)#249 | 35.2%(-7.66)#11,719 |
1
Common Questions
What are the Top Zip Codes with the Highest Percentage of Renter-Occupied Units in London, KY?
Top Zip Codes with the Highest Percentage of Renter-Occupied Units in London, KY are:
What zip code has the Highest Percentage of Renter-Occupied Units in London, KY?
40741 has the Highest Percentage of Renter-Occupied Units in London, KY with 30.5%.
What is the Percentage of Renter-Occupied Units in London, KY?
Percentage of Renter-Occupied Units in London is 48.9%.
What is the Percentage of Renter-Occupied Units in Kentucky?
Percentage of Renter-Occupied Units in Kentucky is 31.9%.
What is the Percentage of Renter-Occupied Units in the United States?
Percentage of Renter-Occupied Units in the United States is 35.2%.