Cities with the Highest Percentage of Population Employed in Manufacturing in Kentucky
RELATED REPORTS & OPTIONS
Manufacturing
Kentucky
Compare Cities
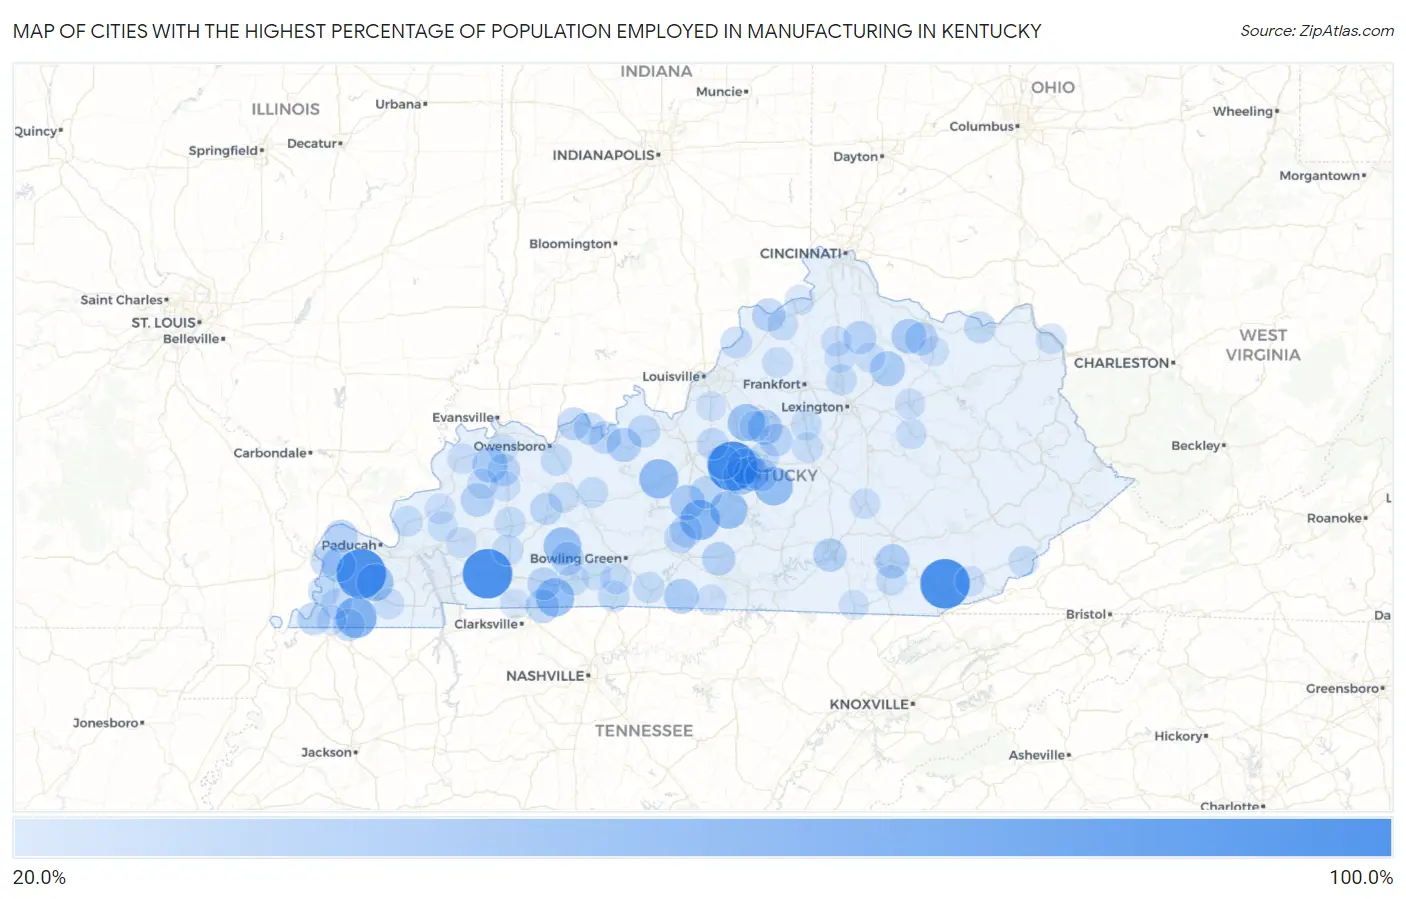
Map of Cities with the Highest Percentage of Population Employed in Manufacturing in Kentucky
0.0%
100.0%
Cities with the Highest Percentage of Population Employed in Manufacturing in Kentucky
| City | % Employed | vs State | vs National | |
| 1. | Lowes | 100.0% | 14.2%(+85.8)#1 | 10.0%(+90.0)#8 |
| 2. | Arjay | 100.0% | 14.2%(+85.8)#2 | 10.0%(+90.0)#23 |
| 3. | Gracey | 100.0% | 14.2%(+85.8)#3 | 10.0%(+90.0)#31 |
| 4. | New Hope | 100.0% | 14.2%(+85.8)#4 | 10.0%(+90.0)#52 |
| 5. | Water Valley | 64.8% | 14.2%(+50.6)#5 | 10.0%(+54.8)#158 |
| 6. | Hardyville | 60.8% | 14.2%(+46.6)#6 | 10.0%(+50.8)#195 |
| 7. | Big Clifty | 58.2% | 14.2%(+44.0)#7 | 10.0%(+48.2)#224 |
| 8. | Bradfordsville | 55.2% | 14.2%(+41.0)#8 | 10.0%(+45.2)#272 |
| 9. | Allensville | 54.8% | 14.2%(+40.6)#9 | 10.0%(+44.8)#281 |
| 10. | Dunmor | 52.3% | 14.2%(+38.1)#10 | 10.0%(+42.3)#334 |
| 11. | Summersville | 52.1% | 14.2%(+37.8)#11 | 10.0%(+42.1)#340 |
| 12. | Fairfield | 50.0% | 14.2%(+35.8)#12 | 10.0%(+40.0)#371 |
| 13. | Hickory | 50.0% | 14.2%(+35.8)#13 | 10.0%(+40.0)#380 |
| 14. | Raywick | 47.5% | 14.2%(+33.3)#14 | 10.0%(+37.6)#461 |
| 15. | Loretto | 45.8% | 14.2%(+31.6)#15 | 10.0%(+35.8)#523 |
| 16. | Poole | 42.1% | 14.2%(+27.9)#16 | 10.0%(+32.1)#692 |
| 17. | Bonnieville | 41.7% | 14.2%(+27.5)#17 | 10.0%(+31.7)#721 |
| 18. | Millersburg | 41.6% | 14.2%(+27.3)#18 | 10.0%(+31.6)#732 |
| 19. | Chaplin | 41.0% | 14.2%(+26.8)#19 | 10.0%(+31.0)#756 |
| 20. | Fountain Run | 41.0% | 14.2%(+26.8)#20 | 10.0%(+31.0)#757 |
| 21. | Sardis | 40.9% | 14.2%(+26.7)#21 | 10.0%(+30.9)#765 |
| 22. | St Mary | 40.8% | 14.2%(+26.6)#22 | 10.0%(+30.8)#774 |
| 23. | Blandville | 39.3% | 14.2%(+25.1)#23 | 10.0%(+29.3)#879 |
| 24. | New Haven | 38.7% | 14.2%(+24.5)#24 | 10.0%(+28.7)#918 |
| 25. | Hardinsburg | 38.5% | 14.2%(+24.3)#25 | 10.0%(+28.5)#940 |
| 26. | North Corbin | 38.4% | 14.2%(+24.2)#26 | 10.0%(+28.4)#949 |
| 27. | Guthrie | 36.3% | 14.2%(+22.0)#27 | 10.0%(+26.3)#1,139 |
| 28. | Providence | 35.7% | 14.2%(+21.5)#28 | 10.0%(+25.7)#1,196 |
| 29. | Edmonton | 35.6% | 14.2%(+21.4)#29 | 10.0%(+25.6)#1,207 |
| 30. | Burnside | 35.5% | 14.2%(+21.3)#30 | 10.0%(+25.5)#1,233 |
| 31. | Lewisburg | 35.4% | 14.2%(+21.2)#31 | 10.0%(+25.4)#1,245 |
| 32. | Stanley | 35.1% | 14.2%(+20.9)#32 | 10.0%(+25.1)#1,274 |
| 33. | Mays Lick | 35.0% | 14.2%(+20.8)#33 | 10.0%(+25.0)#1,285 |
| 34. | Prestonville | 34.9% | 14.2%(+20.7)#34 | 10.0%(+24.9)#1,297 |
| 35. | Berry | 34.5% | 14.2%(+20.3)#35 | 10.0%(+24.5)#1,349 |
| 36. | Bandana | 34.1% | 14.2%(+19.9)#36 | 10.0%(+24.1)#1,401 |
| 37. | Lebanon | 33.7% | 14.2%(+19.5)#37 | 10.0%(+23.7)#1,451 |
| 38. | Willisburg | 33.7% | 14.2%(+19.5)#38 | 10.0%(+23.7)#1,458 |
| 39. | Hickman | 33.5% | 14.2%(+19.2)#39 | 10.0%(+23.5)#1,478 |
| 40. | Lewisport | 33.1% | 14.2%(+18.9)#40 | 10.0%(+23.1)#1,547 |
| 41. | Horse Cave | 33.1% | 14.2%(+18.8)#41 | 10.0%(+23.1)#1,551 |
| 42. | Elkton | 33.0% | 14.2%(+18.8)#42 | 10.0%(+23.0)#1,560 |
| 43. | Sebree | 32.3% | 14.2%(+18.1)#43 | 10.0%(+22.3)#1,643 |
| 44. | Irvington | 32.3% | 14.2%(+18.1)#44 | 10.0%(+22.3)#1,644 |
| 45. | Magnolia | 32.0% | 14.2%(+17.8)#45 | 10.0%(+22.0)#1,697 |
| 46. | Cloverport | 32.0% | 14.2%(+17.7)#46 | 10.0%(+22.0)#1,702 |
| 47. | South Carrollton | 31.5% | 14.2%(+17.3)#47 | 10.0%(+21.5)#1,796 |
| 48. | Hawesville | 31.4% | 14.2%(+17.2)#48 | 10.0%(+21.4)#1,813 |
| 49. | Fulton | 31.2% | 14.2%(+17.0)#49 | 10.0%(+21.2)#1,843 |
| 50. | Boston | 29.7% | 14.2%(+15.5)#50 | 10.0%(+19.7)#2,131 |
| 51. | Cave City | 29.6% | 14.2%(+15.4)#51 | 10.0%(+19.6)#2,142 |
| 52. | Vanceburg | 29.4% | 14.2%(+15.2)#52 | 10.0%(+19.4)#2,176 |
| 53. | Wickliffe | 29.0% | 14.2%(+14.8)#53 | 10.0%(+19.1)#2,271 |
| 54. | Westport | 28.9% | 14.2%(+14.7)#54 | 10.0%(+18.9)#2,312 |
| 55. | Scottsville | 28.4% | 14.2%(+14.2)#55 | 10.0%(+18.4)#2,443 |
| 56. | Franklin | 28.1% | 14.2%(+13.9)#56 | 10.0%(+18.1)#2,540 |
| 57. | Columbus | 28.0% | 14.2%(+13.8)#57 | 10.0%(+18.0)#2,551 |
| 58. | Masonville | 27.7% | 14.2%(+13.5)#58 | 10.0%(+17.7)#2,635 |
| 59. | Clinton | 27.4% | 14.2%(+13.2)#59 | 10.0%(+17.4)#2,705 |
| 60. | Mortons Gap | 27.4% | 14.2%(+13.2)#60 | 10.0%(+17.4)#2,730 |
| 61. | Crofton | 26.7% | 14.2%(+12.5)#61 | 10.0%(+16.7)#2,942 |
| 62. | Woodburn | 26.6% | 14.2%(+12.4)#62 | 10.0%(+16.6)#2,967 |
| 63. | Russellville | 26.5% | 14.2%(+12.3)#63 | 10.0%(+16.5)#2,990 |
| 64. | Georgetown | 26.5% | 14.2%(+12.3)#64 | 10.0%(+16.5)#2,993 |
| 65. | Bloomfield | 26.5% | 14.2%(+12.2)#65 | 10.0%(+16.5)#3,002 |
| 66. | Salvisa | 26.4% | 14.2%(+12.2)#66 | 10.0%(+16.4)#3,020 |
| 67. | Rosine | 26.4% | 14.2%(+12.2)#67 | 10.0%(+16.4)#3,022 |
| 68. | Burna | 26.3% | 14.2%(+12.1)#68 | 10.0%(+16.3)#3,045 |
| 69. | Worthville | 26.0% | 14.2%(+11.8)#69 | 10.0%(+16.0)#3,130 |
| 70. | Pleasureville | 25.9% | 14.2%(+11.7)#70 | 10.0%(+15.9)#3,177 |
| 71. | Springfield | 25.9% | 14.2%(+11.7)#71 | 10.0%(+15.9)#3,184 |
| 72. | Centertown | 25.8% | 14.2%(+11.6)#72 | 10.0%(+15.8)#3,196 |
| 73. | Princeton | 25.5% | 14.2%(+11.3)#73 | 10.0%(+15.6)#3,279 |
| 74. | Farmington | 25.5% | 14.2%(+11.3)#74 | 10.0%(+15.5)#3,283 |
| 75. | Russell | 25.5% | 14.2%(+11.3)#75 | 10.0%(+15.5)#3,303 |
| 76. | Clay City | 25.5% | 14.2%(+11.3)#76 | 10.0%(+15.5)#3,304 |
| 77. | Harrodsburg | 25.4% | 14.2%(+11.2)#77 | 10.0%(+15.5)#3,312 |
| 78. | Rockholds | 25.3% | 14.2%(+11.1)#78 | 10.0%(+15.3)#3,360 |
| 79. | Sadieville | 25.3% | 14.2%(+11.1)#79 | 10.0%(+15.3)#3,370 |
| 80. | Benham | 25.3% | 14.2%(+11.0)#80 | 10.0%(+15.3)#3,380 |
| 81. | Corinth | 25.2% | 14.2%(+11.0)#81 | 10.0%(+15.2)#3,395 |
| 82. | Dixon | 24.9% | 14.2%(+10.7)#82 | 10.0%(+14.9)#3,521 |
| 83. | Marion | 24.9% | 14.2%(+10.7)#83 | 10.0%(+14.9)#3,532 |
| 84. | Mount Sterling | 24.8% | 14.2%(+10.6)#84 | 10.0%(+14.8)#3,556 |
| 85. | Mount Vernon | 24.8% | 14.2%(+10.6)#85 | 10.0%(+14.8)#3,573 |
| 86. | Tompkinsville | 24.7% | 14.2%(+10.5)#86 | 10.0%(+14.7)#3,605 |
| 87. | Philpot | 24.6% | 14.2%(+10.4)#87 | 10.0%(+14.6)#3,627 |
| 88. | Morganfield | 24.4% | 14.2%(+10.2)#88 | 10.0%(+14.4)#3,706 |
| 89. | Slaughters | 24.4% | 14.2%(+10.1)#89 | 10.0%(+14.4)#3,707 |
| 90. | Cynthiana | 24.3% | 14.2%(+10.1)#90 | 10.0%(+14.3)#3,721 |
| 91. | Wallins Creek | 24.1% | 14.2%(+9.88)#91 | 10.0%(+14.1)#3,817 |
| 92. | Warsaw | 24.0% | 14.2%(+9.80)#92 | 10.0%(+14.0)#3,844 |
| 93. | Auburn | 23.9% | 14.2%(+9.71)#93 | 10.0%(+13.9)#3,872 |
| 94. | Fredonia | 23.7% | 14.2%(+9.50)#94 | 10.0%(+13.7)#3,955 |
| 95. | Anthoston | 23.7% | 14.2%(+9.49)#95 | 10.0%(+13.7)#3,958 |
| 96. | Flemingsburg | 23.5% | 14.2%(+9.25)#96 | 10.0%(+13.5)#4,047 |
| 97. | Cayce | 23.3% | 14.2%(+9.12)#97 | 10.0%(+13.3)#4,097 |
| 98. | Pine Knot | 23.2% | 14.2%(+9.02)#98 | 10.0%(+13.2)#4,138 |
| 99. | Oak Grove | 23.1% | 14.2%(+8.88)#99 | 10.0%(+13.1)#4,176 |
| 100. | Fox Chase | 23.0% | 14.2%(+8.79)#100 | 10.0%(+13.0)#4,221 |
Common Questions
What are the Top 10 Cities with the Highest Percentage of Population Employed in Manufacturing in Kentucky?
Top 10 Cities with the Highest Percentage of Population Employed in Manufacturing in Kentucky are:
#1
100.0%
#2
100.0%
#3
100.0%
#4
100.0%
#5
64.8%
#6
60.8%
#7
58.2%
#8
55.2%
#9
54.8%
#10
52.3%
What city has the Highest Percentage of Population Employed in Manufacturing in Kentucky?
Lowes has the Highest Percentage of Population Employed in Manufacturing in Kentucky with 100.0%.
What is the Percentage of Population Employed in Manufacturing in the State of Kentucky?
Percentage of Population Employed in Manufacturing in Kentucky is 14.2%.
What is the Percentage of Population Employed in Manufacturing in the United States?
Percentage of Population Employed in Manufacturing in the United States is 10.0%.