Cities with the Highest Percentage of Population Employed in Information in Kentucky
RELATED REPORTS & OPTIONS
Information & Technology
Kentucky
Compare Cities
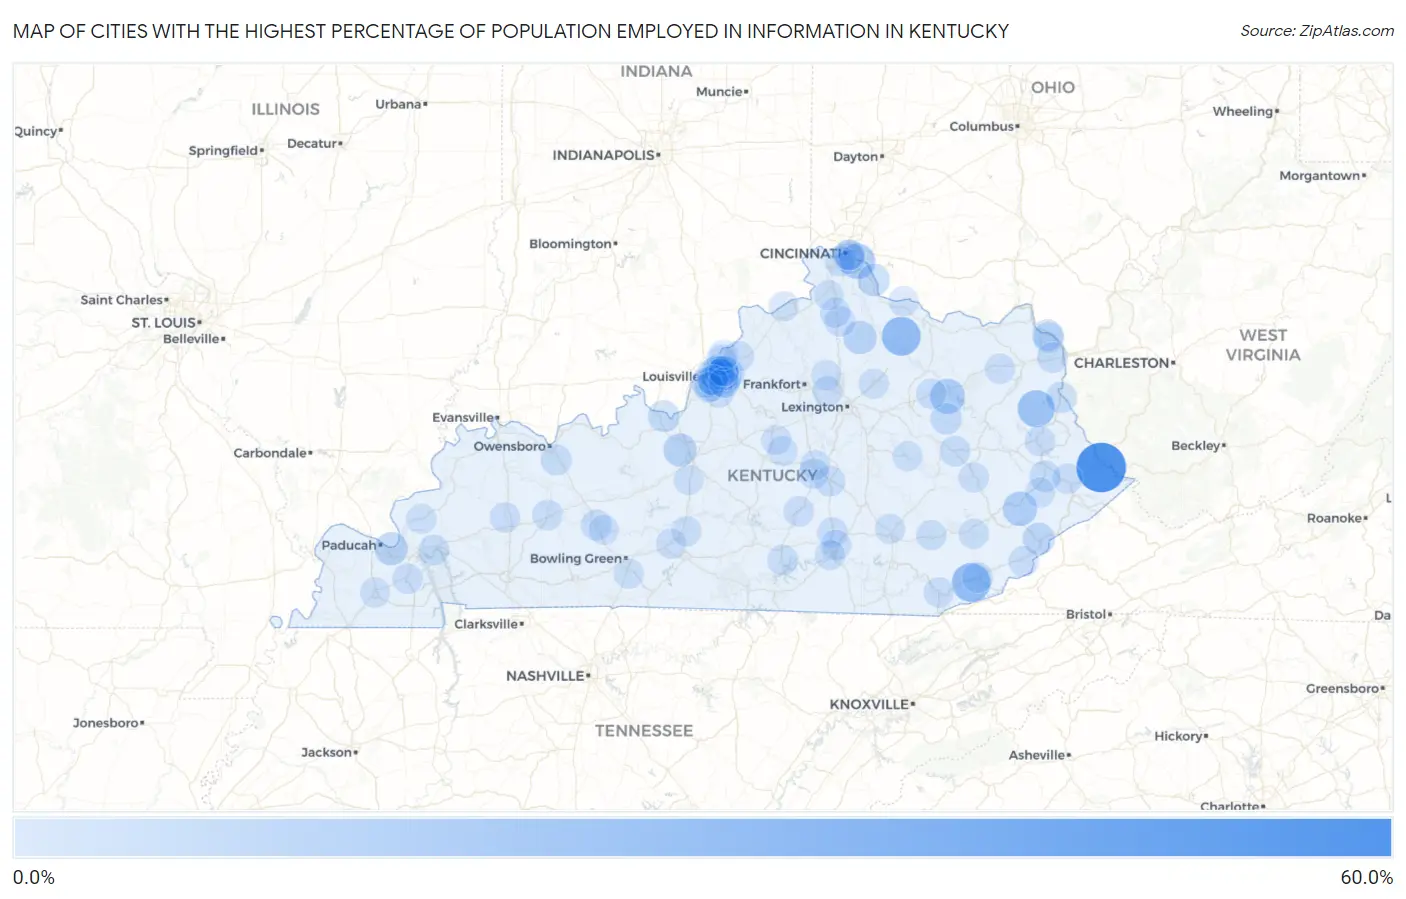
Map of Cities with the Highest Percentage of Population Employed in Information in Kentucky
0.0%
60.0%
Cities with the Highest Percentage of Population Employed in Information in Kentucky
| City | % Employed | vs State | vs National | |
| 1. | Belfry | 53.3% | 1.4%(+52.0)#1 | 1.9%(+51.4)#18 |
| 2. | Mount Olivet | 24.5% | 1.4%(+23.1)#2 | 1.9%(+22.6)#78 |
| 3. | South Wallins | 24.4% | 1.4%(+23.0)#3 | 1.9%(+22.5)#80 |
| 4. | Blaine | 20.0% | 1.4%(+18.6)#4 | 1.9%(+18.1)#108 |
| 5. | Silver Grove | 15.7% | 1.4%(+14.3)#5 | 1.9%(+13.8)#174 |
| 6. | West Van Lear | 14.8% | 1.4%(+13.4)#6 | 1.9%(+12.9)#196 |
| 7. | Salt Lick | 14.6% | 1.4%(+13.2)#7 | 1.9%(+12.7)#200 |
| 8. | Hindman | 13.0% | 1.4%(+11.7)#8 | 1.9%(+11.1)#250 |
| 9. | Berry | 10.3% | 1.4%(+8.96)#9 | 1.9%(+8.45)#365 |
| 10. | Ledbetter | 10.1% | 1.4%(+8.75)#10 | 1.9%(+8.23)#383 |
| 11. | Meadowbrook Farm | 10.0% | 1.4%(+8.62)#11 | 1.9%(+8.10)#395 |
| 12. | Rineyville | 9.7% | 1.4%(+8.36)#12 | 1.9%(+7.84)#418 |
| 13. | California | 7.9% | 1.4%(+6.51)#13 | 1.9%(+6.00)#596 |
| 14. | Whitesburg | 7.2% | 1.4%(+5.84)#14 | 1.9%(+5.32)#717 |
| 15. | Doe Valley | 6.2% | 1.4%(+4.87)#15 | 1.9%(+4.35)#946 |
| 16. | Anchorage | 5.9% | 1.4%(+4.48)#16 | 1.9%(+3.97)#1,078 |
| 17. | Frenchburg | 5.8% | 1.4%(+4.46)#17 | 1.9%(+3.94)#1,082 |
| 18. | Martin | 5.4% | 1.4%(+4.04)#18 | 1.9%(+3.53)#1,257 |
| 19. | Raceland | 5.2% | 1.4%(+3.86)#19 | 1.9%(+3.34)#1,348 |
| 20. | Louisa | 5.0% | 1.4%(+3.65)#20 | 1.9%(+3.13)#1,450 |
| 21. | Morgantown | 4.5% | 1.4%(+3.16)#21 | 1.9%(+2.65)#1,745 |
| 22. | Kuttawa | 4.4% | 1.4%(+3.06)#22 | 1.9%(+2.55)#1,823 |
| 23. | Yelvington | 4.4% | 1.4%(+3.05)#23 | 1.9%(+2.54)#1,838 |
| 24. | Masonville | 4.4% | 1.4%(+3.03)#24 | 1.9%(+2.51)#1,856 |
| 25. | Flatwoods | 4.2% | 1.4%(+2.87)#25 | 1.9%(+2.35)#1,994 |
| 26. | Goose Creek | 4.2% | 1.4%(+2.86)#26 | 1.9%(+2.34)#2,002 |
| 27. | Indian Hills | 4.2% | 1.4%(+2.79)#27 | 1.9%(+2.28)#2,058 |
| 28. | Campton | 4.2% | 1.4%(+2.79)#28 | 1.9%(+2.27)#2,069 |
| 29. | Richlawn | 4.1% | 1.4%(+2.71)#29 | 1.9%(+2.19)#2,141 |
| 30. | Williamstown | 4.1% | 1.4%(+2.70)#30 | 1.9%(+2.18)#2,154 |
| 31. | Southgate | 4.0% | 1.4%(+2.61)#31 | 1.9%(+2.09)#2,237 |
| 32. | Loyall | 4.0% | 1.4%(+2.60)#32 | 1.9%(+2.08)#2,246 |
| 33. | Plantation | 3.9% | 1.4%(+2.53)#33 | 1.9%(+2.01)#2,319 |
| 34. | Cannonsburg | 3.9% | 1.4%(+2.52)#34 | 1.9%(+2.00)#2,340 |
| 35. | Stanford | 3.8% | 1.4%(+2.44)#35 | 1.9%(+1.92)#2,427 |
| 36. | Sycamore | 3.7% | 1.4%(+2.37)#36 | 1.9%(+1.85)#2,513 |
| 37. | Moorland | 3.7% | 1.4%(+2.36)#37 | 1.9%(+1.84)#2,528 |
| 38. | Woodlawn | 3.7% | 1.4%(+2.29)#38 | 1.9%(+1.77)#2,626 |
| 39. | Benham | 3.6% | 1.4%(+2.23)#39 | 1.9%(+1.71)#2,702 |
| 40. | Meadowview Estates | 3.5% | 1.4%(+2.13)#40 | 1.9%(+1.61)#2,827 |
| 41. | Central City | 3.5% | 1.4%(+2.12)#41 | 1.9%(+1.60)#2,837 |
| 42. | Jeffersontown | 3.5% | 1.4%(+2.12)#42 | 1.9%(+1.60)#2,839 |
| 43. | Fort Mitchell | 3.5% | 1.4%(+2.11)#43 | 1.9%(+1.59)#2,844 |
| 44. | Jamestown | 3.5% | 1.4%(+2.08)#44 | 1.9%(+1.56)#2,891 |
| 45. | Mockingbird Valley | 3.4% | 1.4%(+2.07)#45 | 1.9%(+1.55)#2,903 |
| 46. | Newport | 3.4% | 1.4%(+2.06)#46 | 1.9%(+1.55)#2,907 |
| 47. | Benton | 3.4% | 1.4%(+2.04)#47 | 1.9%(+1.52)#2,941 |
| 48. | Park City | 3.4% | 1.4%(+2.02)#48 | 1.9%(+1.50)#2,970 |
| 49. | Buckner | 3.4% | 1.4%(+1.98)#49 | 1.9%(+1.46)#3,017 |
| 50. | Science Hill | 3.3% | 1.4%(+1.96)#50 | 1.9%(+1.45)#3,047 |
| 51. | Spring Mill | 3.3% | 1.4%(+1.92)#51 | 1.9%(+1.40)#3,125 |
| 52. | Paintsville | 3.3% | 1.4%(+1.87)#52 | 1.9%(+1.35)#3,186 |
| 53. | Owingsville | 3.2% | 1.4%(+1.83)#53 | 1.9%(+1.31)#3,254 |
| 54. | Liberty | 3.2% | 1.4%(+1.83)#54 | 1.9%(+1.31)#3,255 |
| 55. | Midway | 3.2% | 1.4%(+1.82)#55 | 1.9%(+1.30)#3,265 |
| 56. | Hills And Dales | 3.2% | 1.4%(+1.79)#56 | 1.9%(+1.28)#3,323 |
| 57. | Junction City | 3.2% | 1.4%(+1.78)#57 | 1.9%(+1.27)#3,345 |
| 58. | Dry Ridge | 3.1% | 1.4%(+1.75)#58 | 1.9%(+1.23)#3,411 |
| 59. | Wellington | 3.1% | 1.4%(+1.72)#59 | 1.9%(+1.20)#3,466 |
| 60. | Broeck Pointe | 3.1% | 1.4%(+1.67)#60 | 1.9%(+1.16)#3,548 |
| 61. | Somerset | 3.1% | 1.4%(+1.67)#61 | 1.9%(+1.15)#3,556 |
| 62. | Earlington | 3.0% | 1.4%(+1.65)#62 | 1.9%(+1.13)#3,595 |
| 63. | Watterson Park | 3.0% | 1.4%(+1.62)#63 | 1.9%(+1.11)#3,661 |
| 64. | Lyndon | 3.0% | 1.4%(+1.61)#64 | 1.9%(+1.10)#3,683 |
| 65. | Brownsboro Village | 3.0% | 1.4%(+1.59)#65 | 1.9%(+1.08)#3,716 |
| 66. | Pineville | 3.0% | 1.4%(+1.59)#66 | 1.9%(+1.07)#3,724 |
| 67. | Glenview Manor | 3.0% | 1.4%(+1.59)#67 | 1.9%(+1.07)#3,728 |
| 68. | Hyden | 3.0% | 1.4%(+1.58)#68 | 1.9%(+1.07)#3,733 |
| 69. | Coal Run Village | 2.9% | 1.4%(+1.56)#69 | 1.9%(+1.04)#3,767 |
| 70. | Kingsley | 2.9% | 1.4%(+1.56)#70 | 1.9%(+1.04)#3,771 |
| 71. | Jackson | 2.9% | 1.4%(+1.53)#71 | 1.9%(+1.01)#3,837 |
| 72. | River Bluff | 2.9% | 1.4%(+1.53)#72 | 1.9%(+1.01)#3,838 |
| 73. | Manchester | 2.9% | 1.4%(+1.52)#73 | 1.9%(+1.01)#3,845 |
| 74. | Olive Hill | 2.9% | 1.4%(+1.52)#74 | 1.9%(+1.00)#3,855 |
| 75. | Old Brownsboro Place | 2.9% | 1.4%(+1.51)#75 | 1.9%(+0.992)#3,878 |
| 76. | Horse Cave | 2.9% | 1.4%(+1.49)#76 | 1.9%(+0.970)#3,936 |
| 77. | Salem | 2.9% | 1.4%(+1.48)#77 | 1.9%(+0.959)#3,958 |
| 78. | Graymoor Devondale | 2.9% | 1.4%(+1.47)#78 | 1.9%(+0.957)#3,974 |
| 79. | Parkway Village | 2.8% | 1.4%(+1.45)#79 | 1.9%(+0.937)#4,011 |
| 80. | Lynnview | 2.8% | 1.4%(+1.45)#80 | 1.9%(+0.934)#4,015 |
| 81. | Seneca Gardens | 2.8% | 1.4%(+1.41)#81 | 1.9%(+0.889)#4,119 |
| 82. | Wayland | 2.8% | 1.4%(+1.40)#82 | 1.9%(+0.879)#4,144 |
| 83. | Woodbury | 2.8% | 1.4%(+1.40)#83 | 1.9%(+0.879)#4,149 |
| 84. | Irvine | 2.7% | 1.4%(+1.37)#84 | 1.9%(+0.851)#4,211 |
| 85. | Paris | 2.7% | 1.4%(+1.32)#85 | 1.9%(+0.805)#4,335 |
| 86. | Forest Hills | 2.7% | 1.4%(+1.30)#86 | 1.9%(+0.780)#4,404 |
| 87. | Goshen | 2.7% | 1.4%(+1.29)#87 | 1.9%(+0.777)#4,409 |
| 88. | Langdon Place | 2.7% | 1.4%(+1.29)#88 | 1.9%(+0.771)#4,425 |
| 89. | Burnside | 2.7% | 1.4%(+1.29)#89 | 1.9%(+0.768)#4,433 |
| 90. | Verona | 2.7% | 1.4%(+1.28)#90 | 1.9%(+0.761)#4,456 |
| 91. | Mayfield | 2.7% | 1.4%(+1.27)#91 | 1.9%(+0.755)#4,480 |
| 92. | Augusta | 2.6% | 1.4%(+1.24)#92 | 1.9%(+0.722)#4,558 |
| 93. | Mackville | 2.6% | 1.4%(+1.23)#93 | 1.9%(+0.710)#4,587 |
| 94. | Willisburg | 2.6% | 1.4%(+1.21)#94 | 1.9%(+0.692)#4,640 |
| 95. | Stamping Ground | 2.6% | 1.4%(+1.20)#95 | 1.9%(+0.688)#4,648 |
| 96. | Sonora | 2.6% | 1.4%(+1.18)#96 | 1.9%(+0.666)#4,720 |
| 97. | East Bernstadt | 2.5% | 1.4%(+1.16)#97 | 1.9%(+0.647)#4,784 |
| 98. | Danville | 2.5% | 1.4%(+1.11)#98 | 1.9%(+0.592)#4,938 |
| 99. | Ghent | 2.5% | 1.4%(+1.10)#99 | 1.9%(+0.586)#4,958 |
| 100. | Plano | 2.5% | 1.4%(+1.09)#100 | 1.9%(+0.569)#5,024 |
Common Questions
What are the Top 10 Cities with the Highest Percentage of Population Employed in Information in Kentucky?
Top 10 Cities with the Highest Percentage of Population Employed in Information in Kentucky are:
#1
53.3%
#2
24.5%
#3
24.4%
#4
20.0%
#5
15.7%
#6
14.6%
#7
13.0%
#8
10.3%
#9
10.1%
#10
10.0%
What city has the Highest Percentage of Population Employed in Information in Kentucky?
Belfry has the Highest Percentage of Population Employed in Information in Kentucky with 53.3%.
What is the Percentage of Population Employed in Information in the State of Kentucky?
Percentage of Population Employed in Information in Kentucky is 1.4%.
What is the Percentage of Population Employed in Information in the United States?
Percentage of Population Employed in Information in the United States is 1.9%.