Cities with the Highest Percentage of Renter-Occupied Units in Kentucky
RELATED REPORTS & OPTIONS
Highest Renter-Occupied
Kentucky
Compare Cities
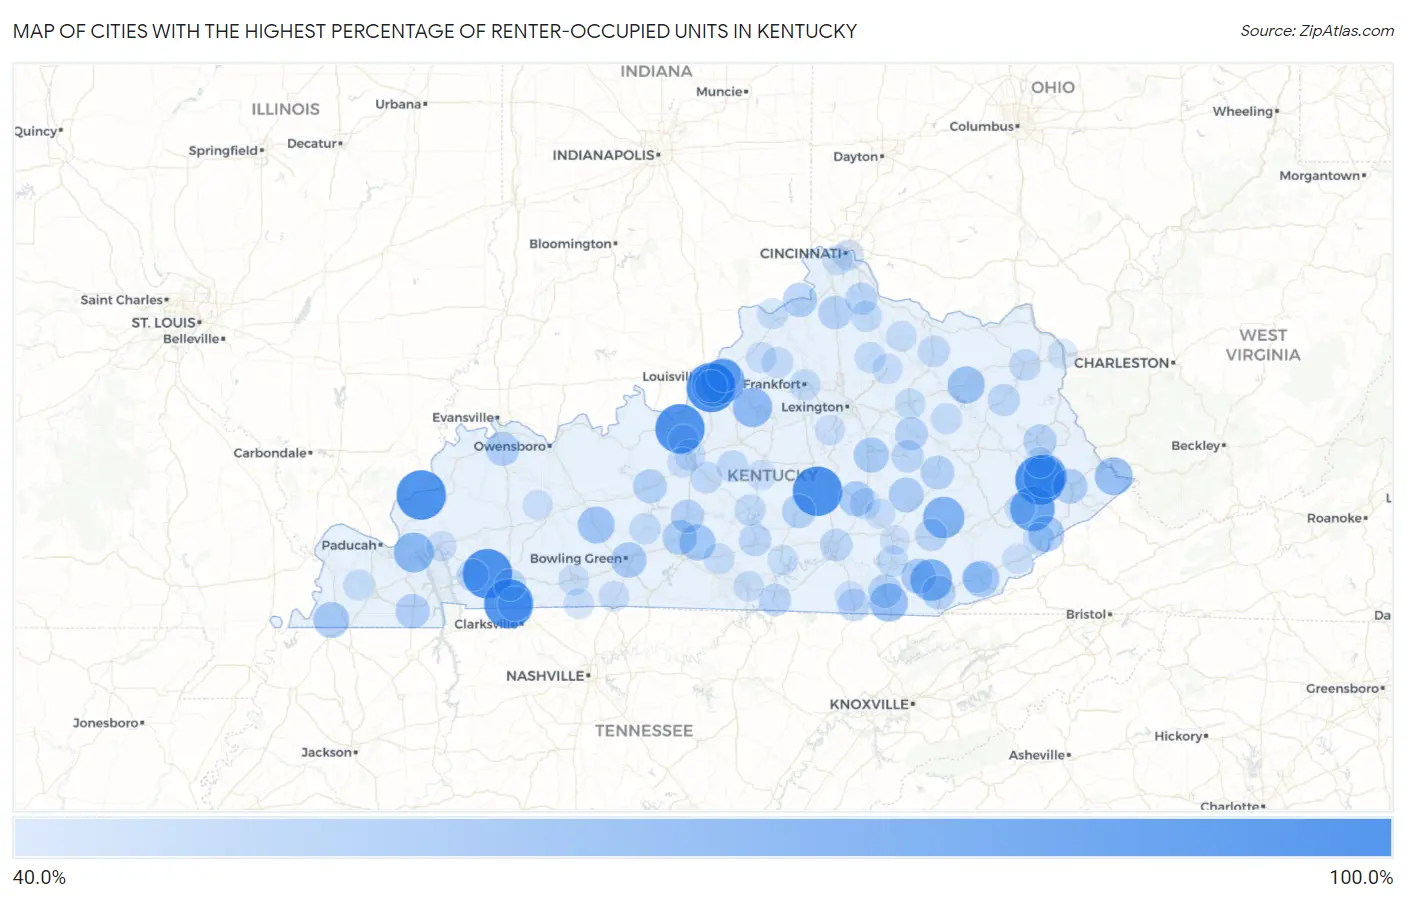
Map of Cities with the Highest Percentage of Renter-Occupied Units in Kentucky
0.0%
100.0%
Cities with the Highest Percentage of Renter-Occupied Units in Kentucky
| City | % Renter-Occupied | vs State | vs National | |
| 1. | Poplar Hills | 100.0% | 31.9%(+68.1)#1 | 35.2%(+64.8)#69 |
| 2. | St. Joseph | 100.0% | 31.9%(+68.1)#2 | 35.2%(+64.8)#82 |
| 3. | Gracey | 100.0% | 31.9%(+68.1)#3 | 35.2%(+64.8)#135 |
| 4. | Mckinney | 100.0% | 31.9%(+68.1)#4 | 35.2%(+64.8)#174 |
| 5. | Maytown | 100.0% | 31.9%(+68.1)#5 | 35.2%(+64.8)#204 |
| 6. | Tolu | 100.0% | 31.9%(+68.1)#6 | 35.2%(+64.8)#216 |
| 7. | Fort Knox | 99.3% | 31.9%(+67.5)#7 | 35.2%(+64.2)#243 |
| 8. | Fort Campbell North | 99.2% | 31.9%(+67.3)#8 | 35.2%(+64.0)#250 |
| 9. | Pippa Passes | 87.0% | 31.9%(+55.1)#9 | 35.2%(+51.8)#354 |
| 10. | Hurstbourne Acres | 85.7% | 31.9%(+53.8)#10 | 35.2%(+50.5)#365 |
| 11. | West Buechel | 84.0% | 31.9%(+52.1)#11 | 35.2%(+48.8)#380 |
| 12. | Martin | 83.9% | 31.9%(+52.0)#12 | 35.2%(+48.7)#383 |
| 13. | Flat Lick | 78.6% | 31.9%(+46.7)#13 | 35.2%(+43.4)#472 |
| 14. | Oneida | 78.3% | 31.9%(+46.4)#14 | 35.2%(+43.1)#479 |
| 15. | Gilbertsville | 74.1% | 31.9%(+42.2)#15 | 35.2%(+38.9)#570 |
| 16. | Taylorsville | 72.6% | 31.9%(+40.7)#16 | 35.2%(+37.4)#610 |
| 17. | Curdsville | 69.8% | 31.9%(+37.9)#17 | 35.2%(+34.6)#721 |
| 18. | Pleasant View | 69.7% | 31.9%(+37.8)#18 | 35.2%(+34.5)#728 |
| 19. | Freeburn | 69.0% | 31.9%(+37.1)#19 | 35.2%(+33.8)#765 |
| 20. | Morehead | 67.0% | 31.9%(+35.1)#20 | 35.2%(+31.8)#848 |
| 21. | Morgantown | 66.3% | 31.9%(+34.4)#21 | 35.2%(+31.1)#889 |
| 22. | Harlan | 64.5% | 31.9%(+32.6)#22 | 35.2%(+29.3)#989 |
| 23. | Hiseville | 64.1% | 31.9%(+32.2)#23 | 35.2%(+28.9)#1,021 |
| 24. | Millstone | 63.8% | 31.9%(+31.9)#24 | 35.2%(+28.6)#1,039 |
| 25. | Cayce | 63.6% | 31.9%(+31.8)#25 | 35.2%(+28.5)#1,050 |
| 26. | Bowling Green | 62.1% | 31.9%(+30.2)#26 | 35.2%(+26.9)#1,179 |
| 27. | Brodhead | 61.9% | 31.9%(+30.0)#27 | 35.2%(+26.7)#1,191 |
| 28. | Richmond | 61.6% | 31.9%(+29.7)#28 | 35.2%(+26.4)#1,223 |
| 29. | Barbourville | 61.6% | 31.9%(+29.7)#29 | 35.2%(+26.4)#1,224 |
| 30. | Mckee | 60.9% | 31.9%(+29.0)#30 | 35.2%(+25.7)#1,281 |
| 31. | Cave City | 60.6% | 31.9%(+28.7)#31 | 35.2%(+25.4)#1,313 |
| 32. | Pikeville | 60.6% | 31.9%(+28.7)#32 | 35.2%(+25.4)#1,316 |
| 33. | Oak Grove | 60.5% | 31.9%(+28.6)#33 | 35.2%(+25.3)#1,322 |
| 34. | Warsaw | 59.7% | 31.9%(+27.8)#34 | 35.2%(+24.5)#1,413 |
| 35. | Murray | 59.4% | 31.9%(+27.5)#35 | 35.2%(+24.2)#1,436 |
| 36. | Lyndon | 59.4% | 31.9%(+27.5)#36 | 35.2%(+24.2)#1,439 |
| 37. | Anthoston | 58.8% | 31.9%(+26.9)#37 | 35.2%(+23.6)#1,508 |
| 38. | Clarkson | 58.5% | 31.9%(+26.7)#38 | 35.2%(+23.4)#1,532 |
| 39. | Pineville | 58.4% | 31.9%(+26.5)#39 | 35.2%(+23.2)#1,540 |
| 40. | Beattyville | 57.9% | 31.9%(+26.1)#40 | 35.2%(+22.8)#1,593 |
| 41. | Liberty | 57.8% | 31.9%(+26.0)#41 | 35.2%(+22.7)#1,613 |
| 42. | Williamsburg | 57.6% | 31.9%(+25.8)#42 | 35.2%(+22.5)#1,647 |
| 43. | Paintsville | 57.6% | 31.9%(+25.7)#43 | 35.2%(+22.4)#1,656 |
| 44. | Dry Ridge | 57.4% | 31.9%(+25.6)#44 | 35.2%(+22.3)#1,669 |
| 45. | Munfordville | 57.1% | 31.9%(+25.3)#45 | 35.2%(+22.0)#1,711 |
| 46. | Clay City | 56.6% | 31.9%(+24.7)#46 | 35.2%(+21.4)#1,781 |
| 47. | Pine Knot | 55.1% | 31.9%(+23.2)#47 | 35.2%(+19.9)#2,014 |
| 48. | Watterson Park | 55.0% | 31.9%(+23.1)#48 | 35.2%(+19.8)#2,032 |
| 49. | Irvine | 55.0% | 31.9%(+23.1)#49 | 35.2%(+19.8)#2,039 |
| 50. | Manchester | 54.8% | 31.9%(+23.0)#50 | 35.2%(+19.7)#2,058 |
| 51. | Somerset | 54.8% | 31.9%(+22.9)#51 | 35.2%(+19.6)#2,062 |
| 52. | Columbia | 54.7% | 31.9%(+22.8)#52 | 35.2%(+19.5)#2,076 |
| 53. | Albany | 54.6% | 31.9%(+22.7)#53 | 35.2%(+19.4)#2,096 |
| 54. | Butler | 54.5% | 31.9%(+22.6)#54 | 35.2%(+19.3)#2,115 |
| 55. | Sandy Hook | 54.4% | 31.9%(+22.5)#55 | 35.2%(+19.2)#2,128 |
| 56. | Cadiz | 53.7% | 31.9%(+21.8)#56 | 35.2%(+18.5)#2,240 |
| 57. | Hopkinsville | 53.6% | 31.9%(+21.7)#57 | 35.2%(+18.4)#2,248 |
| 58. | Hodgenville | 53.4% | 31.9%(+21.5)#58 | 35.2%(+18.2)#2,300 |
| 59. | Flemingsburg | 53.3% | 31.9%(+21.4)#59 | 35.2%(+18.1)#2,325 |
| 60. | New Hope | 52.9% | 31.9%(+21.1)#60 | 35.2%(+17.8)#2,397 |
| 61. | Grayson | 52.9% | 31.9%(+21.0)#61 | 35.2%(+17.7)#2,410 |
| 62. | Campbellsville | 52.5% | 31.9%(+20.6)#62 | 35.2%(+17.3)#2,488 |
| 63. | North Corbin | 52.4% | 31.9%(+20.5)#63 | 35.2%(+17.2)#2,500 |
| 64. | Whitesburg | 52.3% | 31.9%(+20.4)#64 | 35.2%(+17.1)#2,528 |
| 65. | Falmouth | 52.2% | 31.9%(+20.3)#65 | 35.2%(+17.0)#2,548 |
| 66. | Brownsville | 52.2% | 31.9%(+20.3)#66 | 35.2%(+17.0)#2,553 |
| 67. | Pleasureville | 52.1% | 31.9%(+20.2)#67 | 35.2%(+16.9)#2,566 |
| 68. | Frankfort | 52.0% | 31.9%(+20.2)#68 | 35.2%(+16.9)#2,584 |
| 69. | Elizabethtown | 51.7% | 31.9%(+19.8)#69 | 35.2%(+16.5)#2,657 |
| 70. | Mount Vernon | 51.5% | 31.9%(+19.6)#70 | 35.2%(+16.3)#2,693 |
| 71. | Frenchburg | 51.4% | 31.9%(+19.5)#71 | 35.2%(+16.2)#2,723 |
| 72. | Hindman | 51.3% | 31.9%(+19.4)#72 | 35.2%(+16.1)#2,763 |
| 73. | Edmonton | 51.3% | 31.9%(+19.4)#73 | 35.2%(+16.1)#2,766 |
| 74. | Cynthiana | 51.3% | 31.9%(+19.4)#74 | 35.2%(+16.1)#2,767 |
| 75. | Loyall | 51.2% | 31.9%(+19.3)#75 | 35.2%(+16.0)#2,773 |
| 76. | Carrollton | 51.2% | 31.9%(+19.3)#76 | 35.2%(+16.0)#2,776 |
| 77. | Mount Sterling | 51.1% | 31.9%(+19.2)#77 | 35.2%(+15.9)#2,814 |
| 78. | Fancy Farm | 51.0% | 31.9%(+19.1)#78 | 35.2%(+15.8)#2,851 |
| 79. | Smithfield | 50.8% | 31.9%(+19.0)#79 | 35.2%(+15.7)#2,885 |
| 80. | Russellville | 50.7% | 31.9%(+18.8)#80 | 35.2%(+15.5)#2,913 |
| 81. | Mount Olivet | 50.6% | 31.9%(+18.7)#81 | 35.2%(+15.4)#2,954 |
| 82. | Adairville | 50.6% | 31.9%(+18.7)#82 | 35.2%(+15.4)#2,955 |
| 83. | Radcliff | 50.5% | 31.9%(+18.6)#83 | 35.2%(+15.3)#2,967 |
| 84. | Franklin | 50.4% | 31.9%(+18.6)#84 | 35.2%(+15.3)#2,978 |
| 85. | Prestonsburg | 50.4% | 31.9%(+18.5)#85 | 35.2%(+15.2)#2,991 |
| 86. | Burkesville | 50.3% | 31.9%(+18.5)#86 | 35.2%(+15.2)#3,006 |
| 87. | Newport | 50.3% | 31.9%(+18.4)#87 | 35.2%(+15.1)#3,010 |
| 88. | Millersburg | 50.2% | 31.9%(+18.4)#88 | 35.2%(+15.1)#3,032 |
| 89. | Wilmore | 50.1% | 31.9%(+18.2)#89 | 35.2%(+14.9)#3,063 |
| 90. | Eddyville | 50.1% | 31.9%(+18.2)#90 | 35.2%(+14.9)#3,067 |
| 91. | Jamestown | 49.7% | 31.9%(+17.8)#91 | 35.2%(+14.5)#3,190 |
| 92. | Whitley City | 49.6% | 31.9%(+17.7)#92 | 35.2%(+14.4)#3,217 |
| 93. | Cumberland | 49.6% | 31.9%(+17.7)#93 | 35.2%(+14.4)#3,223 |
| 94. | Crescent Springs | 49.5% | 31.9%(+17.7)#94 | 35.2%(+14.4)#3,234 |
| 95. | Cecilia | 49.4% | 31.9%(+17.5)#95 | 35.2%(+14.2)#3,281 |
| 96. | Lebanon | 49.4% | 31.9%(+17.5)#96 | 35.2%(+14.2)#3,282 |
| 97. | Livingston | 49.3% | 31.9%(+17.4)#97 | 35.2%(+14.1)#3,300 |
| 98. | Bremen | 49.2% | 31.9%(+17.3)#98 | 35.2%(+14.0)#3,328 |
| 99. | Catlettsburg | 49.0% | 31.9%(+17.1)#99 | 35.2%(+13.8)#3,376 |
| 100. | London | 48.9% | 31.9%(+17.0)#100 | 35.2%(+13.7)#3,413 |
Common Questions
What are the Top 10 Cities with the Highest Percentage of Renter-Occupied Units in Kentucky?
Top 10 Cities with the Highest Percentage of Renter-Occupied Units in Kentucky are:
#1
100.0%
#2
100.0%
#3
100.0%
#4
100.0%
#5
100.0%
#6
99.3%
#7
99.2%
#8
87.0%
#9
85.7%
#10
84.0%
What city has the Highest Percentage of Renter-Occupied Units in Kentucky?
Poplar Hills has the Highest Percentage of Renter-Occupied Units in Kentucky with 100.0%.
What is the Percentage of Renter-Occupied Units in the State of Kentucky?
Percentage of Renter-Occupied Units in Kentucky is 31.9%.
What is the Percentage of Renter-Occupied Units in the United States?
Percentage of Renter-Occupied Units in the United States is 35.2%.