Cities with the Highest Percentage of Population Employed in Construction & Extraction in Kentucky
RELATED REPORTS & OPTIONS
Construction & Extraction
Kentucky
Compare Cities
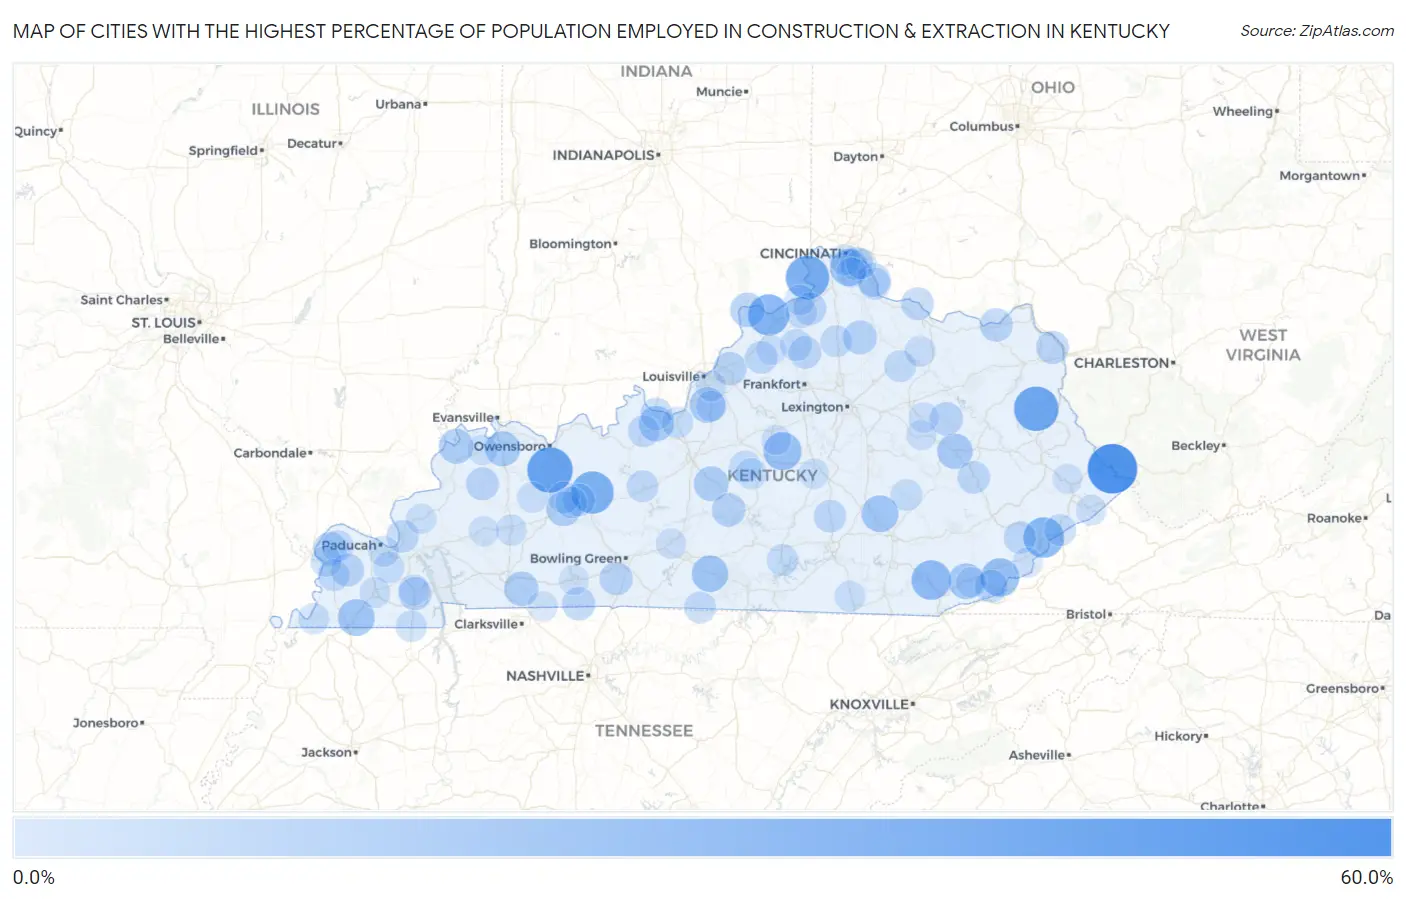
Map of Cities with the Highest Percentage of Population Employed in Construction & Extraction in Kentucky
0.0%
60.0%
Cities with the Highest Percentage of Population Employed in Construction & Extraction in Kentucky
| City | % Employed | vs State | vs National | |
| 1. | Mccarr | 55.7% | 4.7%(+51.0)#1 | 5.0%(+50.7)#121 |
| 2. | Utica | 45.3% | 4.7%(+40.6)#2 | 5.0%(+40.3)#217 |
| 3. | Blaine | 43.3% | 4.7%(+38.6)#3 | 5.0%(+38.3)#238 |
| 4. | Rabbit Hash | 40.0% | 4.7%(+35.3)#4 | 5.0%(+35.0)#281 |
| 5. | Rosine | 37.7% | 4.7%(+33.0)#5 | 5.0%(+32.7)#318 |
| 6. | Prestonville | 34.9% | 4.7%(+30.2)#6 | 5.0%(+29.9)#392 |
| 7. | Mayking | 33.2% | 4.7%(+28.4)#7 | 5.0%(+28.2)#435 |
| 8. | Flat Lick | 30.7% | 4.7%(+25.9)#8 | 5.0%(+25.7)#522 |
| 9. | Kenvir | 28.3% | 4.7%(+23.5)#9 | 5.0%(+23.3)#627 |
| 10. | Mackville | 27.0% | 4.7%(+22.2)#10 | 5.0%(+22.0)#714 |
| 11. | Fairview | 24.7% | 4.7%(+20.0)#11 | 5.0%(+19.7)#864 |
| 12. | Water Valley | 24.1% | 4.7%(+19.3)#12 | 5.0%(+19.1)#909 |
| 13. | Livingston | 24.0% | 4.7%(+19.3)#13 | 5.0%(+19.0)#915 |
| 14. | Summer Shade | 23.4% | 4.7%(+18.7)#14 | 5.0%(+18.4)#969 |
| 15. | Coldiron | 21.7% | 4.7%(+17.0)#15 | 5.0%(+16.7)#1,164 |
| 16. | Campton | 20.8% | 4.7%(+16.1)#16 | 5.0%(+15.8)#1,262 |
| 17. | Brooks | 20.8% | 4.7%(+16.1)#17 | 5.0%(+15.8)#1,272 |
| 18. | Ekron | 20.2% | 4.7%(+15.5)#18 | 5.0%(+15.2)#1,338 |
| 19. | Anthoston | 20.0% | 4.7%(+15.3)#19 | 5.0%(+15.0)#1,359 |
| 20. | Uniontown | 19.5% | 4.7%(+14.8)#20 | 5.0%(+14.5)#1,451 |
| 21. | Buffalo | 19.5% | 4.7%(+14.8)#21 | 5.0%(+14.5)#1,452 |
| 22. | Rockport | 19.0% | 4.7%(+14.3)#22 | 5.0%(+14.1)#1,526 |
| 23. | Milton | 18.6% | 4.7%(+13.9)#23 | 5.0%(+13.6)#1,602 |
| 24. | Pembroke | 18.4% | 4.7%(+13.7)#24 | 5.0%(+13.4)#1,645 |
| 25. | Berry | 17.2% | 4.7%(+12.5)#25 | 5.0%(+12.2)#1,897 |
| 26. | Summersville | 16.4% | 4.7%(+11.7)#26 | 5.0%(+11.4)#2,114 |
| 27. | Frenchburg | 15.8% | 4.7%(+11.1)#27 | 5.0%(+10.8)#2,297 |
| 28. | Worthington Hills | 15.8% | 4.7%(+11.1)#28 | 5.0%(+10.8)#2,299 |
| 29. | California | 15.8% | 4.7%(+11.1)#29 | 5.0%(+10.8)#2,307 |
| 30. | Garrison | 15.8% | 4.7%(+11.0)#30 | 5.0%(+10.8)#2,316 |
| 31. | Woodburn | 15.6% | 4.7%(+10.9)#31 | 5.0%(+10.6)#2,356 |
| 32. | Barlow | 15.6% | 4.7%(+10.8)#32 | 5.0%(+10.6)#2,365 |
| 33. | Dexter | 15.5% | 4.7%(+10.8)#33 | 5.0%(+10.5)#2,371 |
| 34. | Adairville | 15.4% | 4.7%(+10.7)#34 | 5.0%(+10.4)#2,392 |
| 35. | Cunningham | 15.2% | 4.7%(+10.5)#35 | 5.0%(+10.2)#2,465 |
| 36. | Dixon | 15.0% | 4.7%(+10.3)#36 | 5.0%(+10.0)#2,536 |
| 37. | Crestview | 14.9% | 4.7%(+10.2)#37 | 5.0%(+9.90)#2,586 |
| 38. | Ironville | 14.9% | 4.7%(+10.2)#38 | 5.0%(+9.89)#2,591 |
| 39. | Cawood | 14.5% | 4.7%(+9.80)#39 | 5.0%(+9.53)#2,738 |
| 40. | Glencoe | 14.3% | 4.7%(+9.56)#40 | 5.0%(+9.29)#2,800 |
| 41. | Dover | 14.2% | 4.7%(+9.43)#41 | 5.0%(+9.16)#2,863 |
| 42. | Jackson | 14.1% | 4.7%(+9.39)#42 | 5.0%(+9.12)#2,876 |
| 43. | Monterey | 14.0% | 4.7%(+9.23)#43 | 5.0%(+8.96)#2,942 |
| 44. | Beaver Dam | 13.9% | 4.7%(+9.19)#44 | 5.0%(+8.92)#2,958 |
| 45. | Smithland | 13.9% | 4.7%(+9.19)#45 | 5.0%(+8.92)#2,965 |
| 46. | Eubank | 13.7% | 4.7%(+8.97)#46 | 5.0%(+8.70)#3,058 |
| 47. | Blackey | 13.6% | 4.7%(+8.91)#47 | 5.0%(+8.64)#3,090 |
| 48. | Smithfield | 13.6% | 4.7%(+8.84)#48 | 5.0%(+8.57)#3,116 |
| 49. | Brandenburg | 12.8% | 4.7%(+8.12)#49 | 5.0%(+7.85)#3,465 |
| 50. | Centertown | 12.5% | 4.7%(+7.78)#50 | 5.0%(+7.51)#3,620 |
| 51. | Gratz | 12.5% | 4.7%(+7.78)#51 | 5.0%(+7.51)#3,641 |
| 52. | Gamaliel | 12.4% | 4.7%(+7.71)#52 | 5.0%(+7.44)#3,686 |
| 53. | Mentor | 12.4% | 4.7%(+7.67)#53 | 5.0%(+7.40)#3,699 |
| 54. | Jenkins | 12.3% | 4.7%(+7.62)#54 | 5.0%(+7.35)#3,727 |
| 55. | La Center | 12.3% | 4.7%(+7.59)#55 | 5.0%(+7.32)#3,742 |
| 56. | Carlisle | 12.2% | 4.7%(+7.47)#56 | 5.0%(+7.20)#3,809 |
| 57. | Bardwell | 12.2% | 4.7%(+7.45)#57 | 5.0%(+7.18)#3,826 |
| 58. | Corinth | 12.2% | 4.7%(+7.45)#58 | 5.0%(+7.18)#3,828 |
| 59. | Leitchfield | 12.0% | 4.7%(+7.26)#59 | 5.0%(+6.99)#3,938 |
| 60. | Irvington | 12.0% | 4.7%(+7.24)#60 | 5.0%(+6.97)#3,944 |
| 61. | Jamestown | 11.8% | 4.7%(+7.09)#61 | 5.0%(+6.82)#4,046 |
| 62. | Mchenry | 11.8% | 4.7%(+7.08)#62 | 5.0%(+6.81)#4,052 |
| 63. | Mckee | 11.8% | 4.7%(+7.06)#63 | 5.0%(+6.79)#4,061 |
| 64. | Sparta | 11.4% | 4.7%(+6.68)#64 | 5.0%(+6.41)#4,337 |
| 65. | Loretto | 11.3% | 4.7%(+6.55)#65 | 5.0%(+6.28)#4,437 |
| 66. | Hazel | 11.2% | 4.7%(+6.47)#66 | 5.0%(+6.20)#4,492 |
| 67. | Muldraugh | 11.1% | 4.7%(+6.33)#67 | 5.0%(+6.06)#4,628 |
| 68. | Wickliffe | 11.0% | 4.7%(+6.23)#68 | 5.0%(+5.96)#4,693 |
| 69. | Van Lear | 10.9% | 4.7%(+6.18)#69 | 5.0%(+5.92)#4,731 |
| 70. | Symsonia | 10.8% | 4.7%(+6.07)#70 | 5.0%(+5.80)#4,824 |
| 71. | Hickman | 10.6% | 4.7%(+5.86)#71 | 5.0%(+5.59)#4,993 |
| 72. | St Mary | 10.5% | 4.7%(+5.80)#72 | 5.0%(+5.53)#5,052 |
| 73. | Kenton Vale | 10.5% | 4.7%(+5.80)#73 | 5.0%(+5.53)#5,054 |
| 74. | Farley | 10.4% | 4.7%(+5.68)#74 | 5.0%(+5.41)#5,150 |
| 75. | Nortonville | 10.3% | 4.7%(+5.60)#75 | 5.0%(+5.33)#5,250 |
| 76. | Melbourne | 9.9% | 4.7%(+5.22)#76 | 5.0%(+4.95)#5,622 |
| 77. | Ewing | 9.9% | 4.7%(+5.18)#77 | 5.0%(+4.91)#5,661 |
| 78. | Whitley City | 9.9% | 4.7%(+5.13)#78 | 5.0%(+4.87)#5,702 |
| 79. | Mayfield | 9.8% | 4.7%(+5.10)#79 | 5.0%(+4.83)#5,737 |
| 80. | Sacramento | 9.8% | 4.7%(+5.05)#80 | 5.0%(+4.78)#5,783 |
| 81. | Warsaw | 9.7% | 4.7%(+4.98)#81 | 5.0%(+4.71)#5,849 |
| 82. | Fox Chase | 9.6% | 4.7%(+4.86)#82 | 5.0%(+4.59)#5,971 |
| 83. | Hardin | 9.6% | 4.7%(+4.83)#83 | 5.0%(+4.56)#6,004 |
| 84. | South Wallins | 9.5% | 4.7%(+4.73)#84 | 5.0%(+4.46)#6,119 |
| 85. | Jeffersonville | 9.4% | 4.7%(+4.63)#85 | 5.0%(+4.36)#6,212 |
| 86. | Watterson Park | 9.3% | 4.7%(+4.57)#86 | 5.0%(+4.30)#6,302 |
| 87. | Stanton | 9.1% | 4.7%(+4.39)#87 | 5.0%(+4.12)#6,494 |
| 88. | Park City | 9.1% | 4.7%(+4.34)#88 | 5.0%(+4.07)#6,580 |
| 89. | Elkhorn City | 9.0% | 4.7%(+4.31)#89 | 5.0%(+4.04)#6,615 |
| 90. | Corydon | 9.0% | 4.7%(+4.26)#90 | 5.0%(+3.99)#6,668 |
| 91. | Salem | 8.9% | 4.7%(+4.16)#91 | 5.0%(+3.89)#6,760 |
| 92. | Willisburg | 8.8% | 4.7%(+4.08)#92 | 5.0%(+3.81)#6,866 |
| 93. | Junction City | 8.8% | 4.7%(+4.07)#93 | 5.0%(+3.80)#6,889 |
| 94. | Lynch | 8.8% | 4.7%(+4.03)#94 | 5.0%(+3.76)#6,946 |
| 95. | Dawson Springs | 8.7% | 4.7%(+3.93)#95 | 5.0%(+3.66)#7,095 |
| 96. | Guthrie | 8.5% | 4.7%(+3.82)#96 | 5.0%(+3.55)#7,263 |
| 97. | Coal Run Village | 8.5% | 4.7%(+3.79)#97 | 5.0%(+3.52)#7,302 |
| 98. | New Castle | 8.5% | 4.7%(+3.74)#98 | 5.0%(+3.47)#7,376 |
| 99. | Ryland Heights | 8.4% | 4.7%(+3.70)#99 | 5.0%(+3.43)#7,428 |
| 100. | Russellville | 8.4% | 4.7%(+3.65)#100 | 5.0%(+3.38)#7,488 |
Common Questions
What are the Top 10 Cities with the Highest Percentage of Population Employed in Construction & Extraction in Kentucky?
Top 10 Cities with the Highest Percentage of Population Employed in Construction & Extraction in Kentucky are:
#1
55.7%
#2
45.3%
#3
43.3%
#4
40.0%
#5
37.7%
#6
34.9%
#7
33.2%
#8
30.7%
#9
28.3%
#10
27.0%
What city has the Highest Percentage of Population Employed in Construction & Extraction in Kentucky?
McCarr has the Highest Percentage of Population Employed in Construction & Extraction in Kentucky with 55.7%.
What is the Percentage of Population Employed in Construction & Extraction in the State of Kentucky?
Percentage of Population Employed in Construction & Extraction in Kentucky is 4.7%.
What is the Percentage of Population Employed in Construction & Extraction in the United States?
Percentage of Population Employed in Construction & Extraction in the United States is 5.0%.