Zip Codes with the Highest Percentage of White / Caucasian Population in Bowling Green, KY
RELATED REPORTS & OPTIONS
White / Caucasian
Bowling Green
Compare Zip Codes
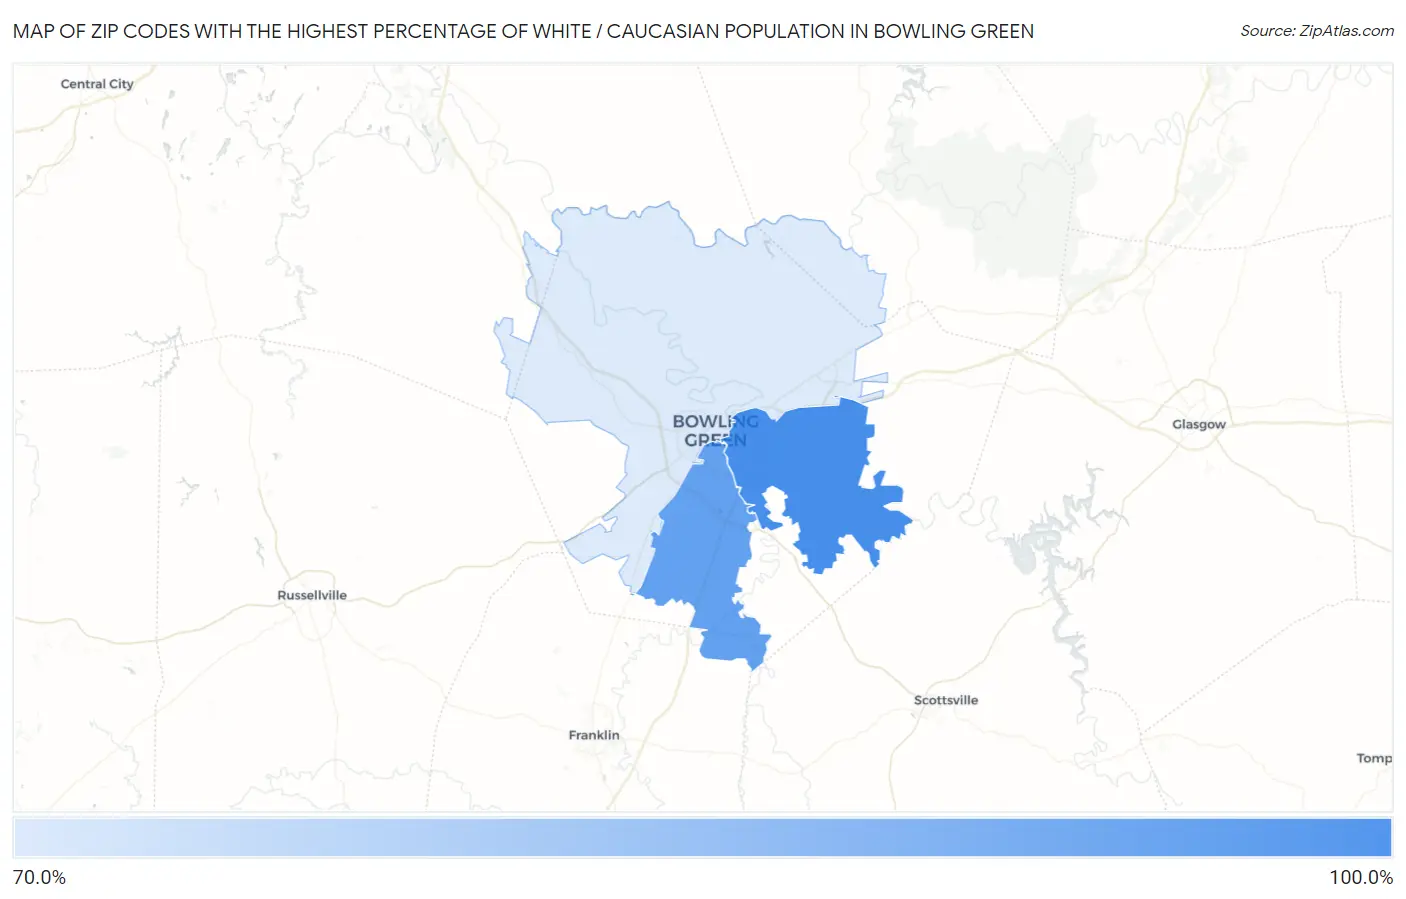
Map of Zip Codes with the Highest Percentage of White / Caucasian Population in Bowling Green
73.0%
84.4%
Zip Codes with the Highest Percentage of White / Caucasian Population in Bowling Green, KY
| Zip Code | White / Caucasian | vs State | vs National | |
| 1. | 42103 | 84.4% | 84.8%(-0.393)#658 | 65.9%(+18.5)#18,751 |
| 2. | 42104 | 82.2% | 84.8%(-2.53)#680 | 65.9%(+16.4)#19,896 |
| 3. | 42101 | 73.0% | 84.8%(-11.8)#729 | 65.9%(+7.11)#23,764 |
1
Common Questions
What are the Top Zip Codes with the Highest Percentage of White / Caucasian Population in Bowling Green, KY?
Top Zip Codes with the Highest Percentage of White / Caucasian Population in Bowling Green, KY are:
What zip code has the Highest Percentage of White / Caucasian Population in Bowling Green, KY?
42103 has the Highest Percentage of White / Caucasian Population in Bowling Green, KY with 84.4%.
What is the Percentage of White / Caucasian Population in Bowling Green, KY?
Percentage of White / Caucasian Population in Bowling Green is 69.6%.
What is the Percentage of White / Caucasian Population in Kentucky?
Percentage of White / Caucasian Population in Kentucky is 84.8%.
What is the Percentage of White / Caucasian Population in the United States?
Percentage of White / Caucasian Population in the United States is 65.9%.