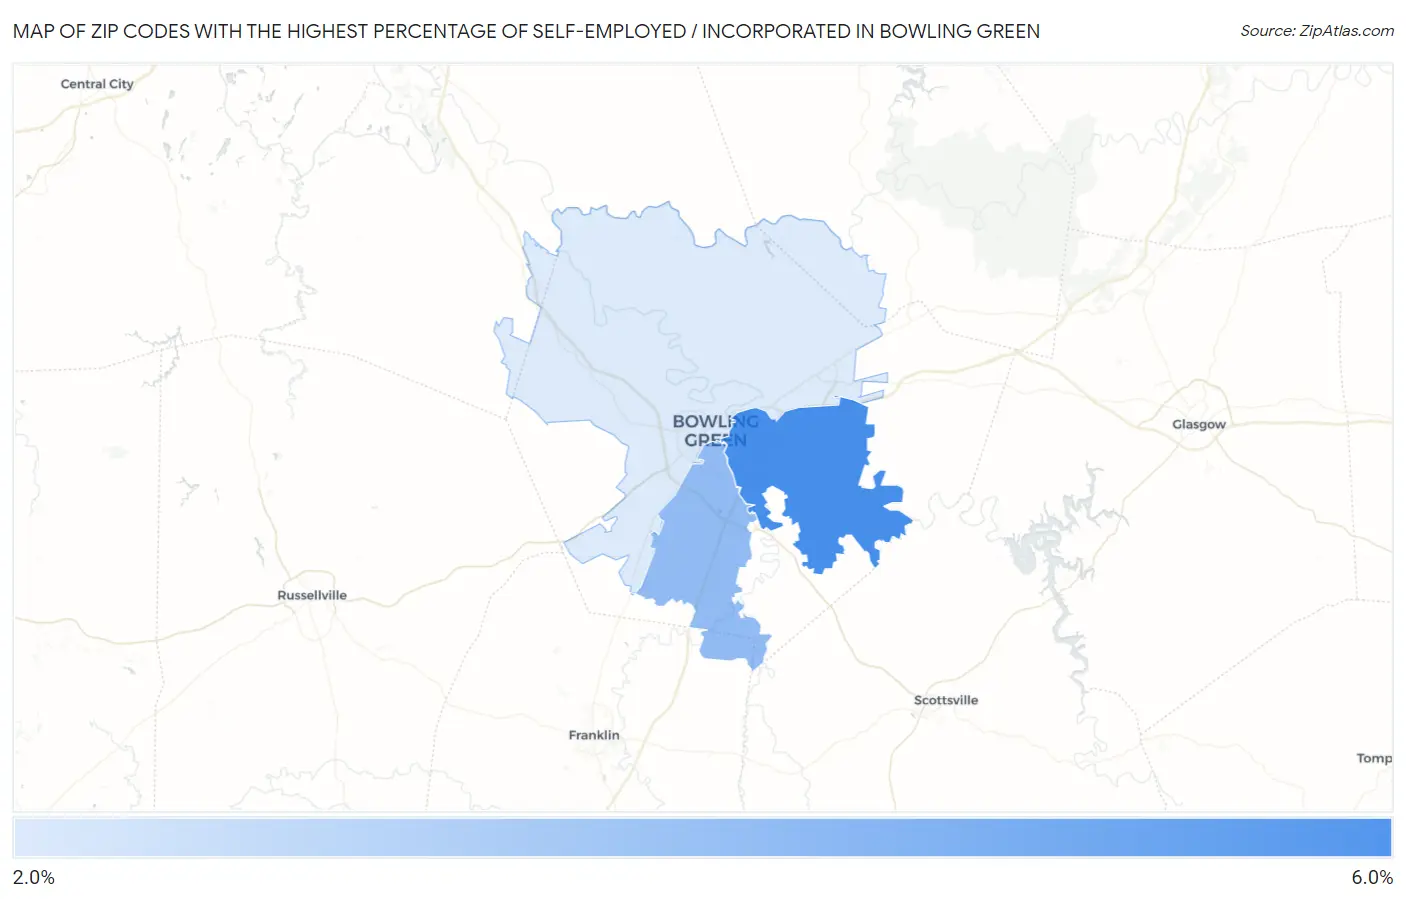
Zip Codes with the Highest Percentage of Self-Employed / Incorporated in Bowling Green, KY
RELATED REPORTS & OPTIONS
Self-Employed / Incorporated
Bowling Green
Compare Zip Codes
Map of Zip Codes with the Highest Percentage of Self-Employed / Incorporated in Bowling Green
2.4%
5.7%
Zip Codes with the Highest Percentage of Self-Employed / Incorporated in Bowling Green, KY
| Zip Code | % Self-Employed / Incorporated | vs State | vs National | |
| 1. | 42103 | 5.7% | 3.0%(+2.70)#90 | 3.8%(+1.90)#6,849 |
| 2. | 42104 | 4.1% | 3.0%(+1.06)#151 | 3.8%(+0.265)#11,587 |
| 3. | 42101 | 2.4% | 3.0%(-0.598)#279 | 3.8%(-1.39)#19,273 |
1
Common Questions
What are the Top Zip Codes with the Highest Percentage of Self-Employed / Incorporated in Bowling Green, KY?
Top Zip Codes with the Highest Percentage of Self-Employed / Incorporated in Bowling Green, KY are:
What zip code has the Highest Percentage of Self-Employed / Incorporated in Bowling Green, KY?
42103 has the Highest Percentage of Self-Employed / Incorporated in Bowling Green, KY with 5.7%.
What is the Percentage of Self-Employed / Incorporated in Bowling Green, KY?
Percentage of Self-Employed / Incorporated in Bowling Green is 2.7%.
What is the Percentage of Self-Employed / Incorporated in Kentucky?
Percentage of Self-Employed / Incorporated in Kentucky is 3.0%.
What is the Percentage of Self-Employed / Incorporated in the United States?
Percentage of Self-Employed / Incorporated in the United States is 3.8%.