Zip Codes with the Highest Percentage of Population Employed in Finance & Insurance in Bowling Green, KY
RELATED REPORTS & OPTIONS
Finance & Insurance
Bowling Green
Compare Zip Codes
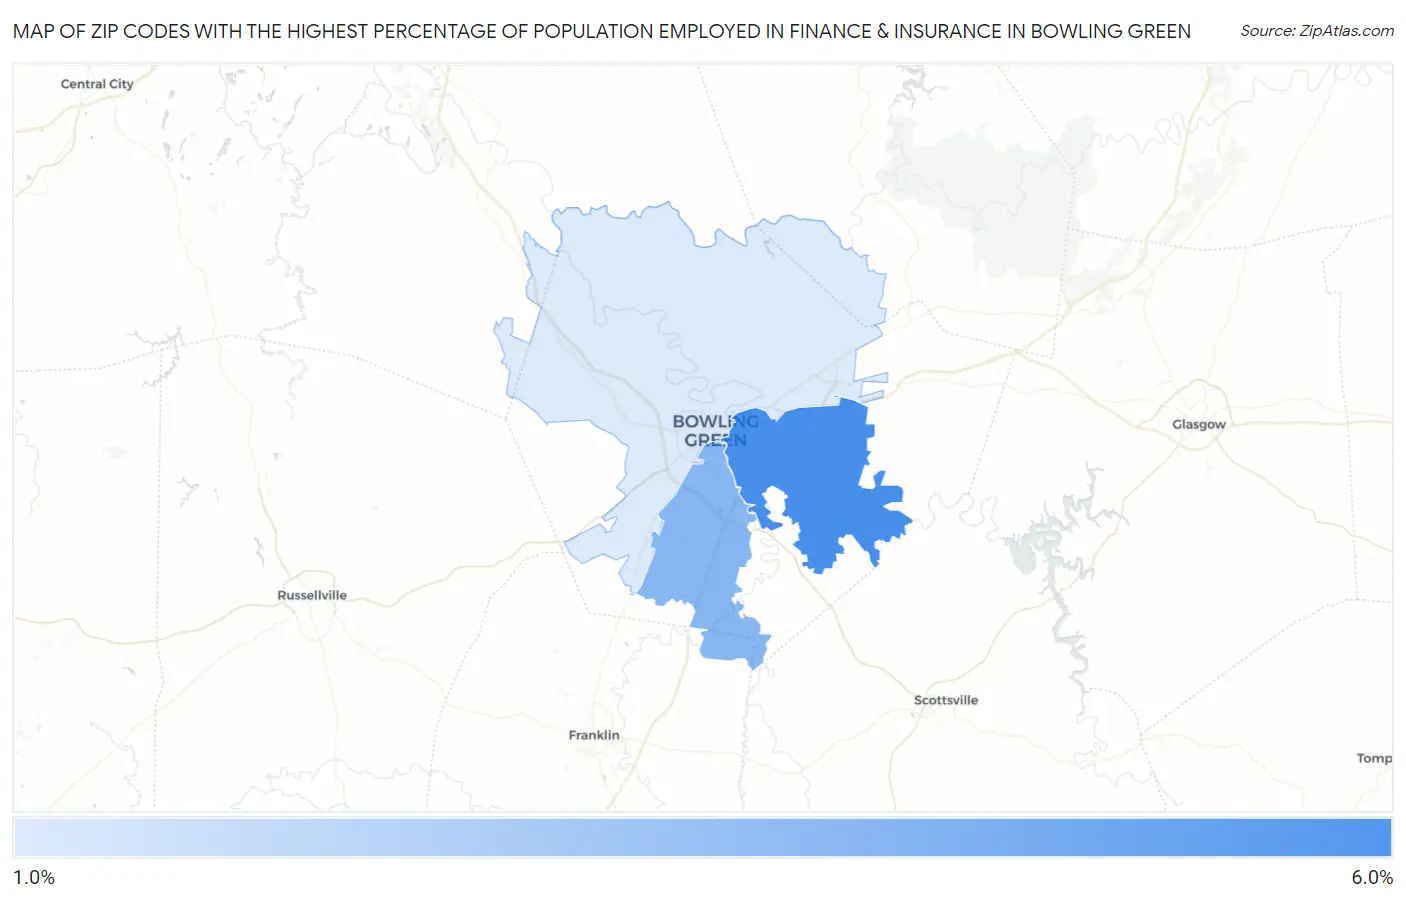
Map of Zip Codes with the Highest Percentage of Population Employed in Finance & Insurance in Bowling Green
0.0%
6.0%
Zip Codes with the Highest Percentage of Population Employed in Finance & Insurance in Bowling Green, KY
| Zip Code | % Employed | vs State | vs National | |
| 1. | 42103 | 5.4% | 4.2%(+1.17)#130 | 4.8%(+0.619)#7,251 |
| 2. | 42104 | 3.7% | 4.2%(-0.501)#212 | 4.8%(-1.05)#12,687 |
| 3. | 42101 | 1.6% | 4.2%(-2.64)#392 | 4.8%(-3.19)#22,215 |
1
Common Questions
What are the Top Zip Codes with the Highest Percentage of Population Employed in Finance & Insurance in Bowling Green, KY?
Top Zip Codes with the Highest Percentage of Population Employed in Finance & Insurance in Bowling Green, KY are:
What zip code has the Highest Percentage of Population Employed in Finance & Insurance in Bowling Green, KY?
42103 has the Highest Percentage of Population Employed in Finance & Insurance in Bowling Green, KY with 5.4%.
What is the Percentage of Population Employed in Finance & Insurance in Bowling Green, KY?
Percentage of Population Employed in Finance & Insurance in Bowling Green is 2.6%.
What is the Percentage of Population Employed in Finance & Insurance in Kentucky?
Percentage of Population Employed in Finance & Insurance in Kentucky is 4.2%.
What is the Percentage of Population Employed in Finance & Insurance in the United States?
Percentage of Population Employed in Finance & Insurance in the United States is 4.8%.