Zip Codes with the Highest Percentage of Population Employed in Farming, Fishing & Forestry in Bowling Green, KY
RELATED REPORTS & OPTIONS
Farming, Fishing & Forestry
Bowling Green
Compare Zip Codes
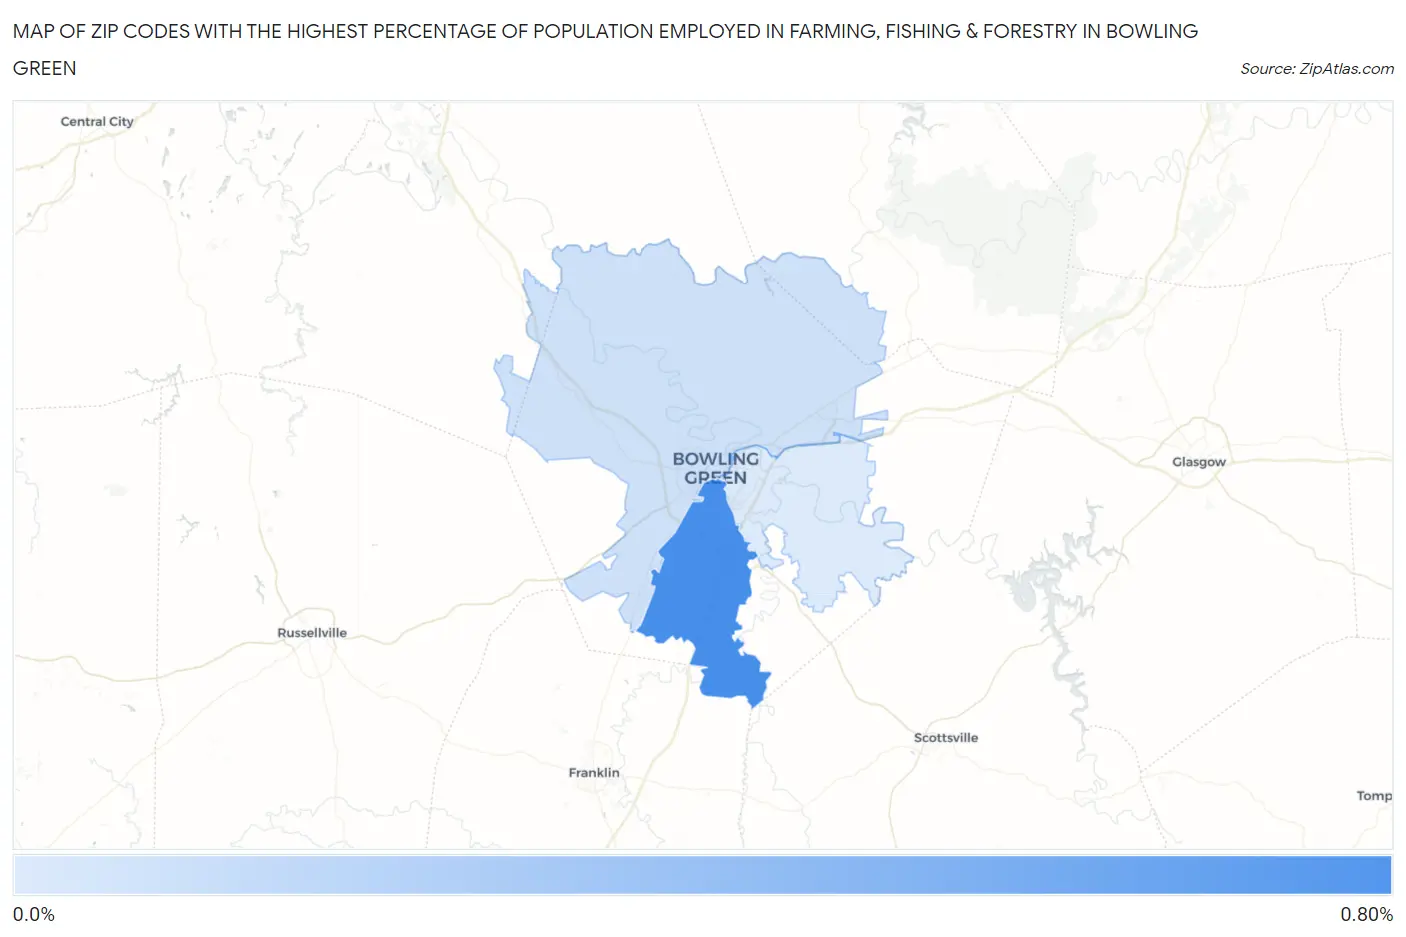
Map of Zip Codes with the Highest Percentage of Population Employed in Farming, Fishing & Forestry in Bowling Green
0.0%
0.80%
Zip Codes with the Highest Percentage of Population Employed in Farming, Fishing & Forestry in Bowling Green, KY
| Zip Code | % Employed | vs State | vs National | |
| 1. | 42104 | 0.76% | 0.52%(+0.244)#168 | 0.61%(+0.156)#11,011 |
| 2. | 42101 | 0.19% | 0.52%(-0.329)#255 | 0.61%(-0.418)#16,304 |
| 3. | 42103 | 0.13% | 0.52%(-0.385)#275 | 0.61%(-0.474)#17,253 |
1
Common Questions
What are the Top Zip Codes with the Highest Percentage of Population Employed in Farming, Fishing & Forestry in Bowling Green, KY?
Top Zip Codes with the Highest Percentage of Population Employed in Farming, Fishing & Forestry in Bowling Green, KY are:
What zip code has the Highest Percentage of Population Employed in Farming, Fishing & Forestry in Bowling Green, KY?
42104 has the Highest Percentage of Population Employed in Farming, Fishing & Forestry in Bowling Green, KY with 0.76%.
What is the Percentage of Population Employed in Farming, Fishing & Forestry in Bowling Green, KY?
Percentage of Population Employed in Farming, Fishing & Forestry in Bowling Green is 0.12%.
What is the Percentage of Population Employed in Farming, Fishing & Forestry in Kentucky?
Percentage of Population Employed in Farming, Fishing & Forestry in Kentucky is 0.52%.
What is the Percentage of Population Employed in Farming, Fishing & Forestry in the United States?
Percentage of Population Employed in Farming, Fishing & Forestry in the United States is 0.61%.